Introduction
The tires are the most important component of any racing vehicle; as they are the only way you can transmit controlling forces to the ground. Understanding the importance of this piece of the car, it was crucial that I selected the best tire and wheel package for our application.
Modeling
To begin this process, I needed to model the tires of interest so I could compare their characteristics. The model I chose was a simplified version of the Pacejka Magic Formula. The coefficients of this model are visualized below.


The model was simplified by removing the Curvature Coefficient ‘E’, which improved the R2 value of the fit while reducing model complexity. An example of this model improvement on our chosen tire is shown.

Yaw Moment Diagrams
With the tire models developed, I needed a way to compare the wheel and tire options to see how they would affect the overall handling characteristics of the vehicle. For this, I chose to construct constant skid pad speed (25 mph) Yaw Moment Diagrams using the design specifications of our vehicle for each wheel tire combination.

These diagrams provide three crucial metrics which can be used to evaluate how the tires will impact cornering performance.
- Maximum Lateral Acceleration: Represented by the X coordinate at the left and right extremities where there is no yaw moment on the vehicle, this predicts the maximum lateral g’s the car can hold in steady-state conditions.
- Maximum Yaw Acceleration: Represented by the Y coordinate at the upper and lower tips, this predicts the maximum yaw acceleration the vehicle can undergo within grip limits based on the yaw moment created by the tires and the yaw inertia of the vehicle.
- Steady State Control: Represented by the Z coordinate at the center of the diagram, this predicts the change in yaw acceleration per change in steering wheel angle and is a good metric of how responsive the vehicle is.
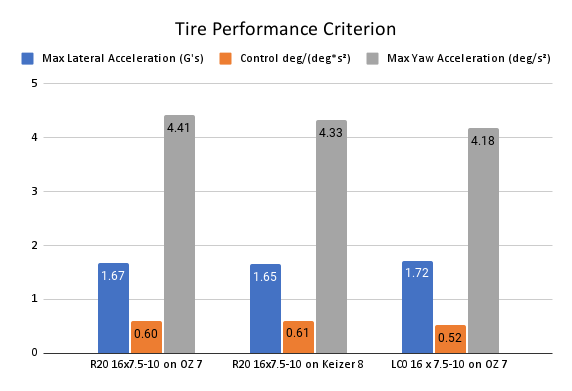
Extracting these datapoints from diagrams created with different wheel and tire combinations allowed me to compare the characteristics of my highest picks for tire and wheel setups. The main tire and wheel combinations I considered were R20’s on 7 inch wide OZ wheels and 8 inch wide Keizer wheels, as well as LC0’s on 7 inch wide OZ wheels.
The inclusion of different wheels proved to be quite important to the performance of the packages as predicted by the diagrams. While the OZ wheels are 28% lighter than the Keizer’s which increases responsiveness by lowering yaw inertia, they have lower cornering stiffness due to their smaller width which decreases responsiveness. Modeling these characteristics together allowed a more complete picture of their effect on the vehicle.

Ultimately, R20’s on OZ 7-inch wide wheels were chosen for this year’s vehicle. Though they don’t have the highest levels of max lateral acceleration or cornering control, they offered a good balance of these characteristics by being a close second for both of these metrics. They also showed the highest maximum yaw acceleration of the setups, very useful on the tight corners often found on FSAE tracks.
Other Factors
Another reason for the selection of the OZ wheels over TAMU’s typical selection of Keizer’s is the significant saving in manufacturing time and complexity at no cost penalty. This is because the OZ’s come as a single-piece wheel where Keizer sells wheel outers which need to be joined to custom wheel centers. When considering the cost of the high strength aluminum that would need to be purchased for these wheel centers, both wheels cost ~$350. The single-piece construction, however, reduces system complexity and saves the team ~40 hours of precision CNC machining time.
Another factor that was considered for the selection of the R20 was pre-season testing, where the drivers found the LC0 compound to be much less predictable than R20’s when using them on real track surfaces. Though this compound performed well once warmed up and scrubbed, they quickly dropped off as they wore down, or got out of their temperature envelope
Tire Characterization
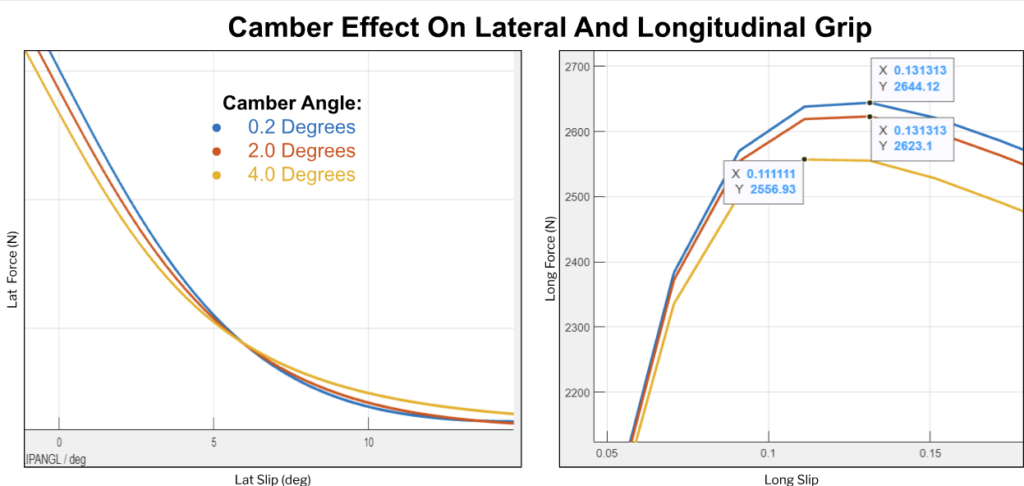
With the wheel and tire package selected, I needed to figure out the best way for the suspension system to orient the tires for maximum performance. The first thing I looked at was camber angles.

As seen in the plots above, increasing camber improves cornering stiffness somewhat linearly, but this comes at the expense of limit cornering grip and longitudinal grip. Noting the large 2.5% drop in longitudinal grip between 2 and 4 degrees of camber, especially relevant with this year’s powerful 4-cylinder powertrain, I worked with the kinematics designer to keep the wheel in the range of 0.2 to 2.0 degrees of camber throughout wheel travel.
Another characteristic I inspected was tire temperature.

From this plot, it can be seen that the highest coefficients of friction occur between 131-138 Degrees F. Knowing this, we could adjust our camber angles on track to keep the tires in their best operating envelope.
Results
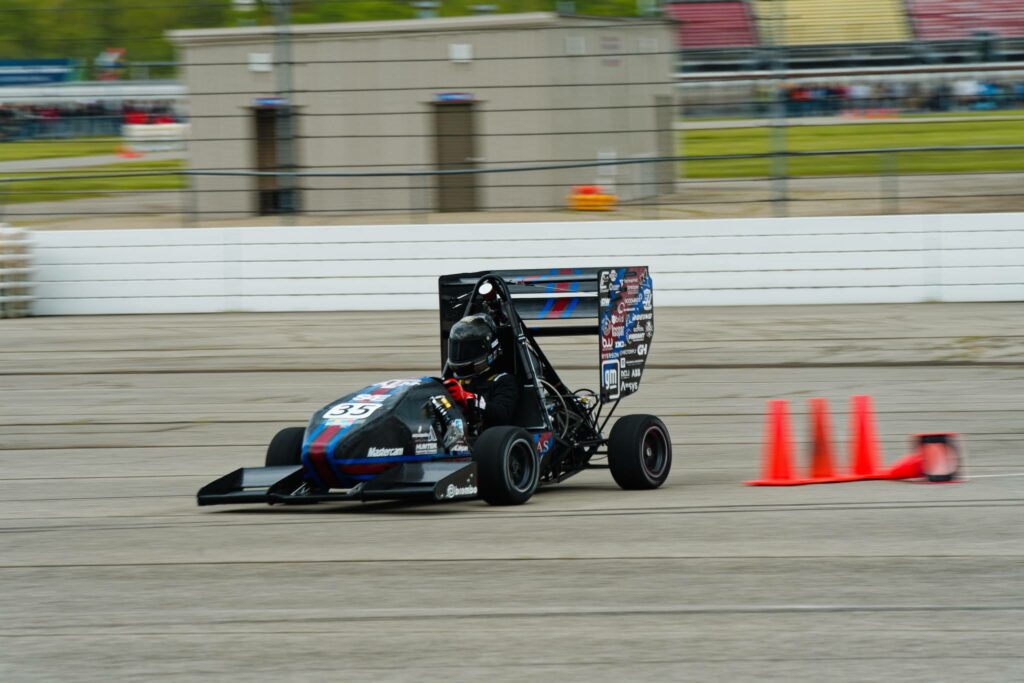
Ultimately this wheel and tire selection was 20% lighter than the previous team’s package, contributing to the lightest TAMU FSAE suspension system ever created, and allowed the vehicle to reach over 1.8 G’s of lateral acceleration on track.

This performance, combined with the system’s reliability to give our drivers ample practice time, contributed to the team’s success at competition; earning 5th in skidpad and 5th overall out of over 100 teams at FSAE Michigan.