Carbon Fiber Suspension Linkages

Introduction

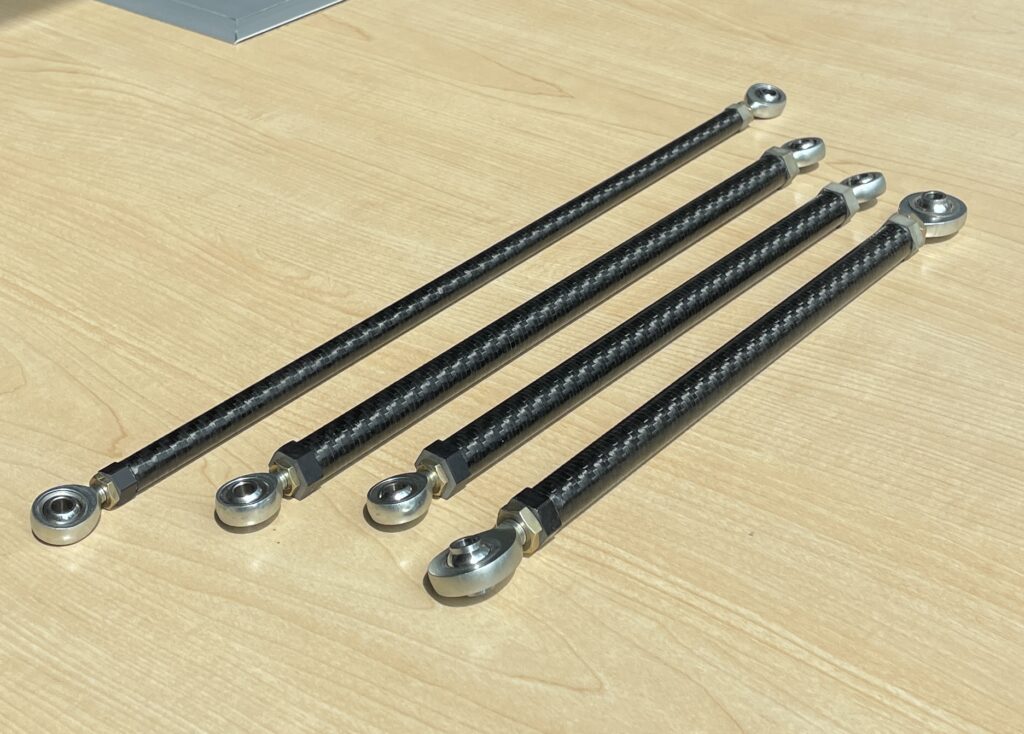
The most common material for FSAE suspension members is steel tubing. These systems can be made reasonably lightweight, but I saw the potential to reduce un-sprung mass even more by using carbon fiber suspension linkages; a first in TAMU’s 25 year FSAE history.

There are two parts to a linkage such as this: the tubing itself and the tube insert that allows attachment to the vehicle. It became quickly evident that the main point of concern when designing linkages like these is not the tubing or inserts themselves, but rather the adhesive bond which must be used to hold them together.

While there are hand calculations that can be performed to predict the strength of adhesive bonds, their estimates are very imprecise. For this reason, I needed to perform physical testing to validate my bonds before I could run these parts on the car.

Instron Test Setup

For this testing, I tested 12 samples of each size linkage I planned to use. All these samples were bonded using Loctite EA20 HP adhesive with a .008″ bond gap.
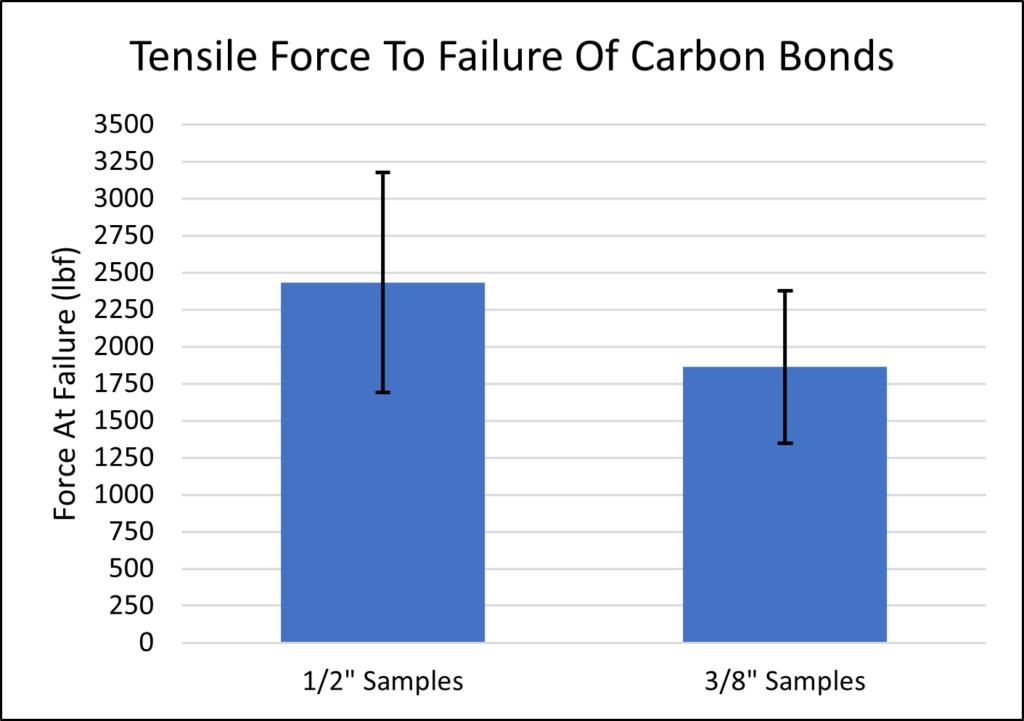
Using the lower bound of the 95% confidence interval shown in the plot, I now had load capacity values that I could use to estimate the FOS of these members. Electing to use these linkages for the push rods and tie rods of the car, the only tensile loading I needed to consider during normal operation occurred in the tie rods. Comparing the tensile capacity from this testing to my predicted load from my vector suspension force calculations gave a tensile FOS of 18 for the rear tie rods and 8 for the front tie rods.

To account for fatigue effects, I referenced a test done by Loctite to estimate how much reduction from initial strength I should expect with cyclic loading. Combining this with an estimate of the number of high G cornering events1 the links should see per mile from testing data, I generated a plot showing FOS as a function of testing miles.
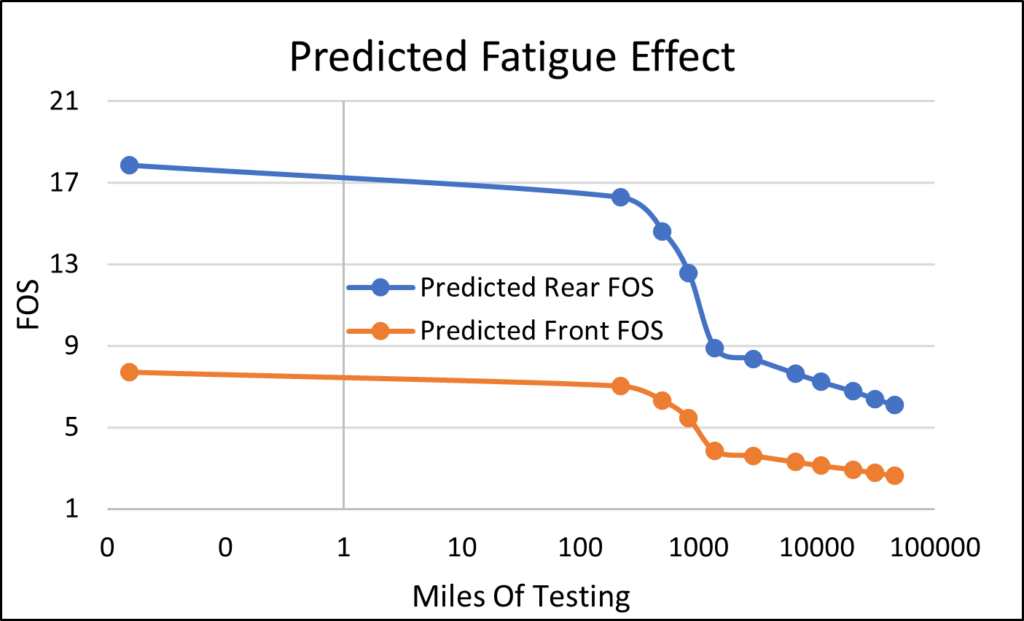
Based on this analysis, the lowest expected factor of safety after the planned 500 miles of testing was 6 for the front link and 15 for the rear link.

To estimate temperature effects, I used the strength vs temperature data on the EA20 HP data sheet to predict strength reduction.
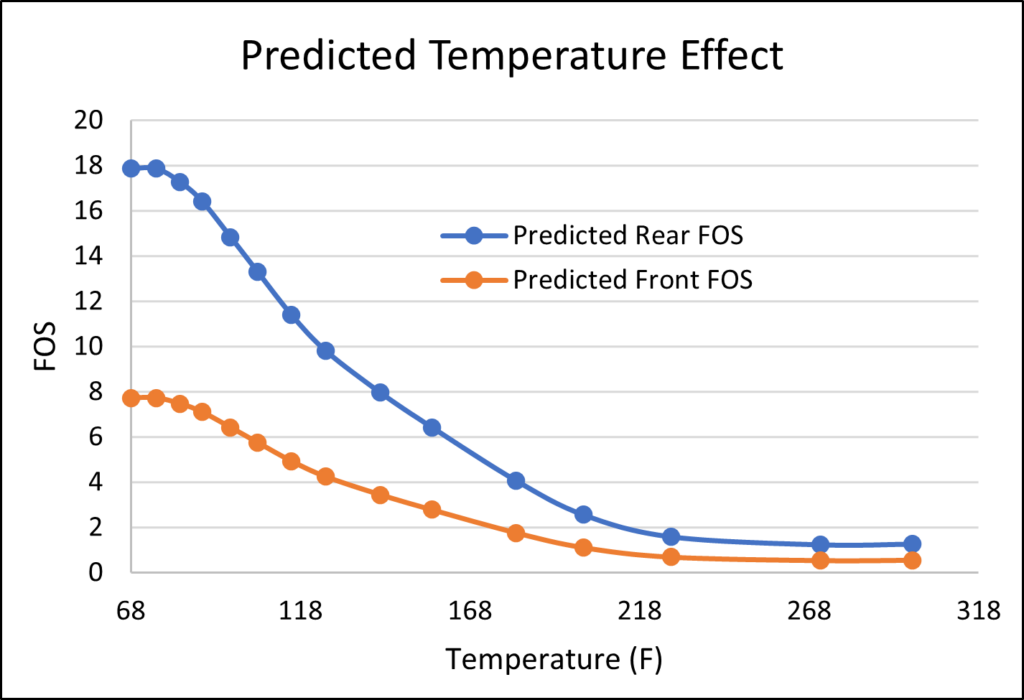
From on track testing, we found the maximum temperature of the links near the bond area to be approximately 120F. At this temperature, the FOS of the rear drops to 10 and the FOS of the front drops to 4. Considering a combined case of 500 miles of testing and a linkage at its max temperature, my worst case FOS was still 3.5 on the front toe rod.

Though there were many assumptions needed to complete this analysis under the tight time and budget restrictions of an FSAE project, I felt the resulting safety factors for the bonds were conservative enough to predict success on track.

Buckling Testing

As the pushrods only see compression with minimal tensile load in normal operation, pull out strength was not a major concern for these links. The more likely failure mode was tube buckling.

With the slenderness ratios of all the pushrods being greater than the critical value, the typical method to evaluate the buckling capacity is with Euler’s Formula. As carbon fiber is an anisotropic composite material, however, I needed to test the flexural rigidity of my rods to be able to use this formula. Knowing this rigidity and the length of each of the rods, this method gave me a rough idea of the pushrod buckling capacity as the length of these rods was modified throughout the kinematics design process.
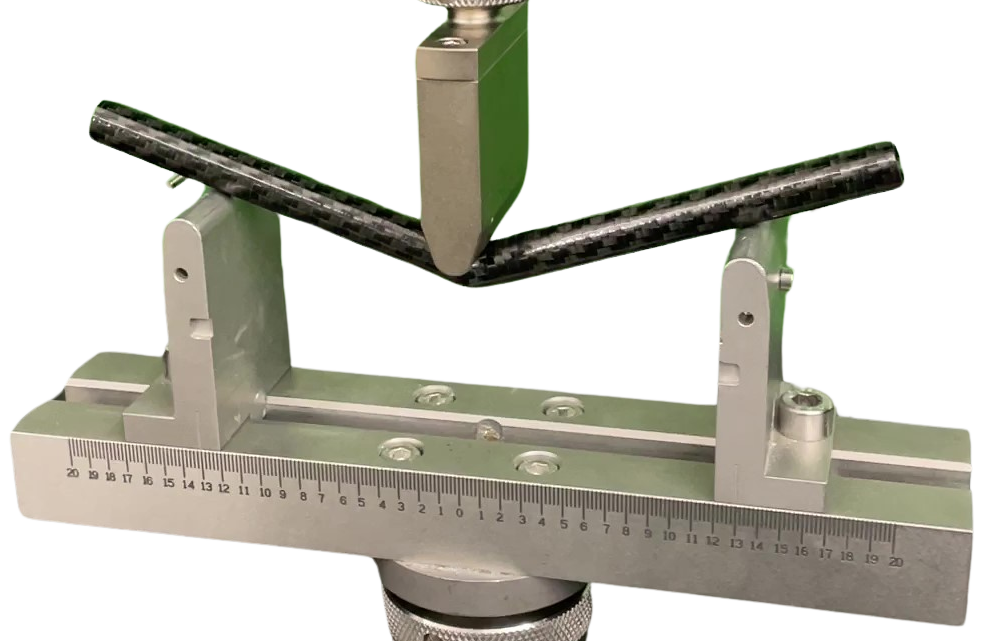
3 Point Bend Flexural Rigidity Test

Near the end of the kinematics design process, the link with the greatest risk of buckling had an FOS of ~2. Given the low predictability of composites and the assumptions inherent in Euler Buckling Calculations, I believed this factor was too low to proceed without further inspection, so a buckling test was performed on this link.
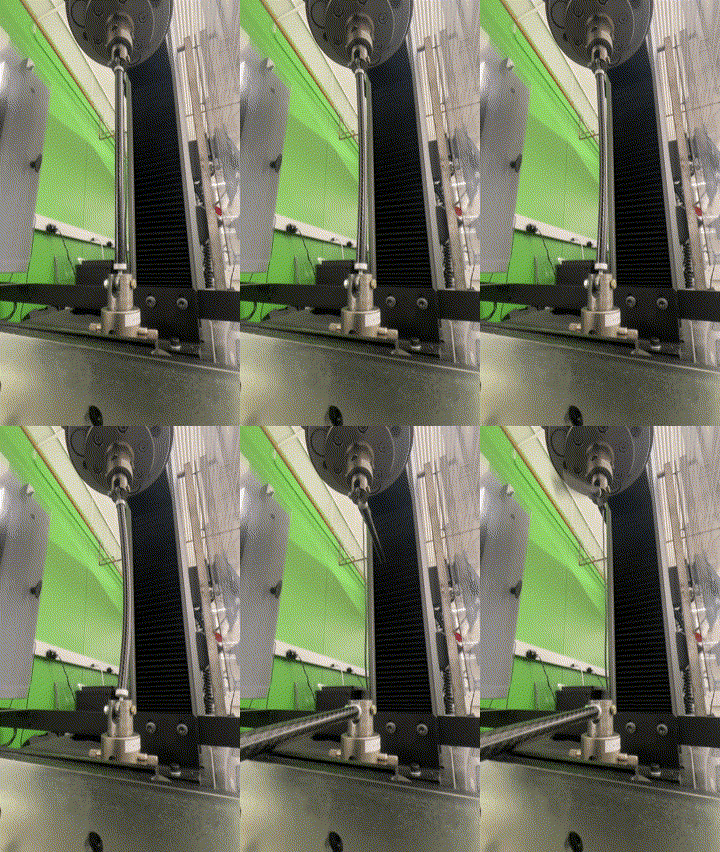
Carbon Fiber Buckling Test

I was glad I challenged my calculations with this test, as the results showed a buckling load that was slightly lower than originally predicted. With these test results now projecting an FOS of 1.4, this design was slightly riskier that I was willing to accept. To combat this, I worked with the suspension actuation designer to make the linkage as short as possible, ultimately shortening it by from 16 inches to 13 inches. Performing another buckling test resulted in an FOS of 2.4 for this link, a notable improvement from the previous design.
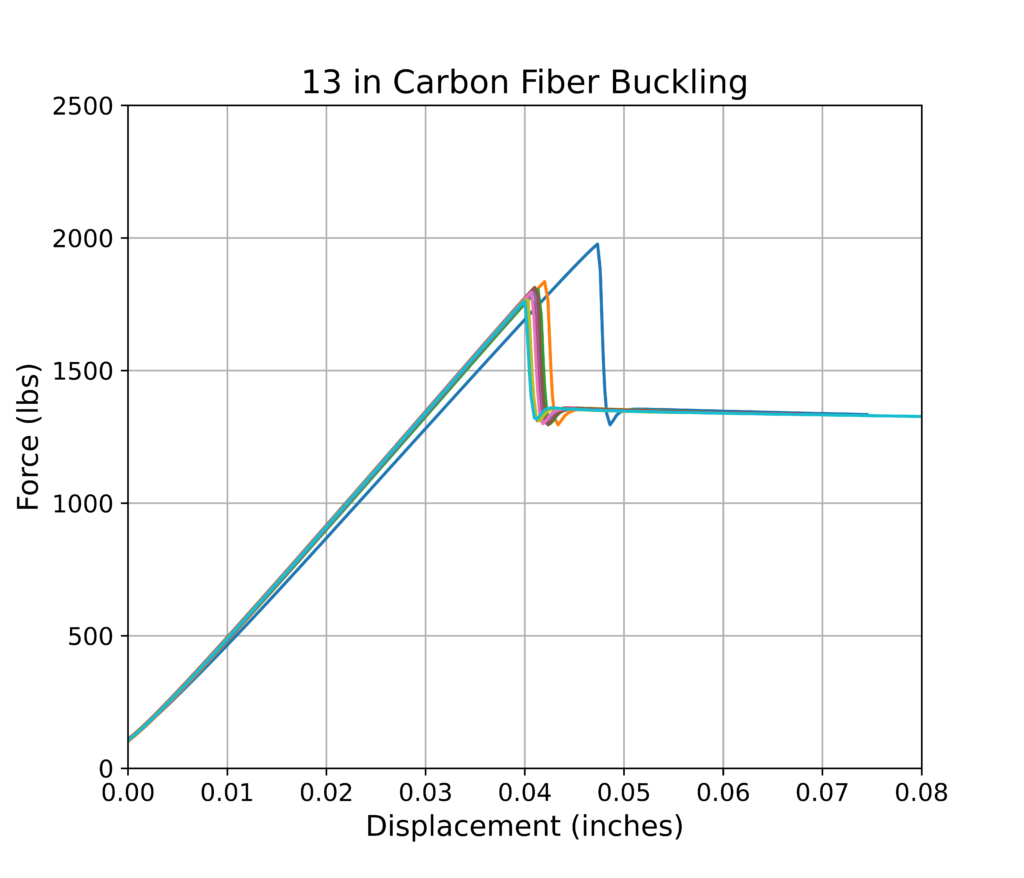
Another promising property of these carbon fiber links which you may have noticed from the testing videos was its ability to rebound after buckling. This can be seen in the testing data above, showing multiple buckling and rebound cycles for a single linkage. This means that even if a linkage were pushed to its buckling load for a brief moment on track, it could rebound to its original shape multiple times and continue functioning; so long as this load is not sustained for an extended time.

With the new FOS for the onset of buckling and the ability of the tubing to rebound from dynamic buckling, I felt sufficiently confident to install these components for full vehicle testing.

Weight Reduction

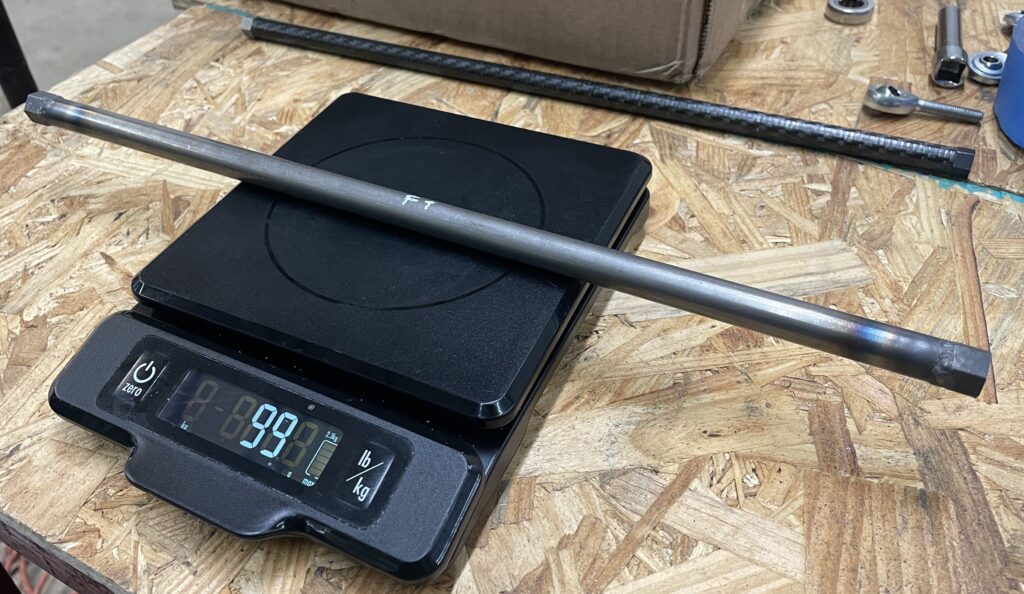
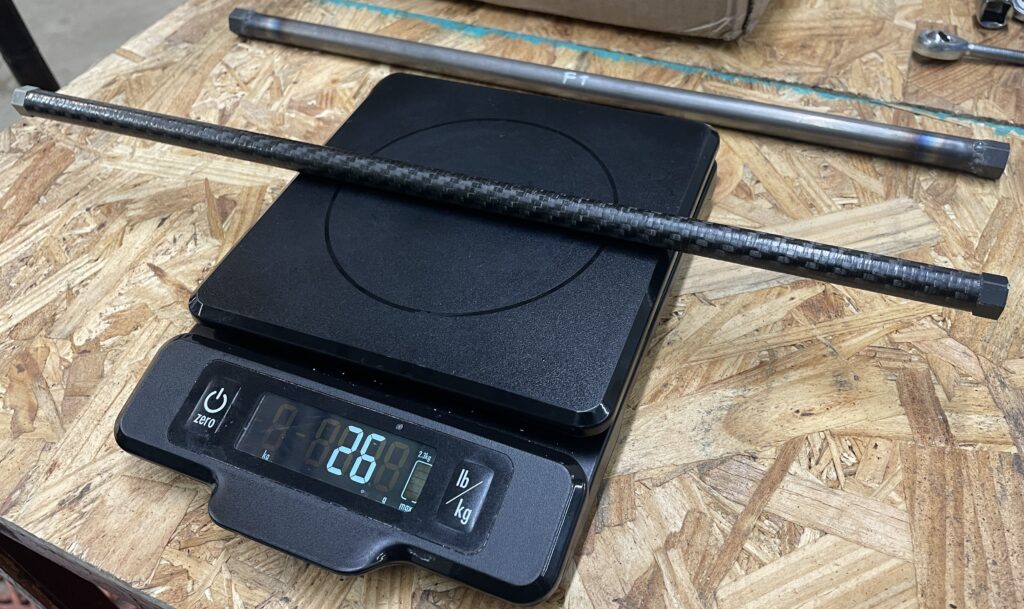
Comparing my carbon fiber linkages to a set of spare steel linkages made for the car, the carbon fiber were found to be as light as nearly a quarter the weight of a comparable steel link, and have a conservatively estimated stiffness to weight ratio almost double that of the steel.
On-Track Performance

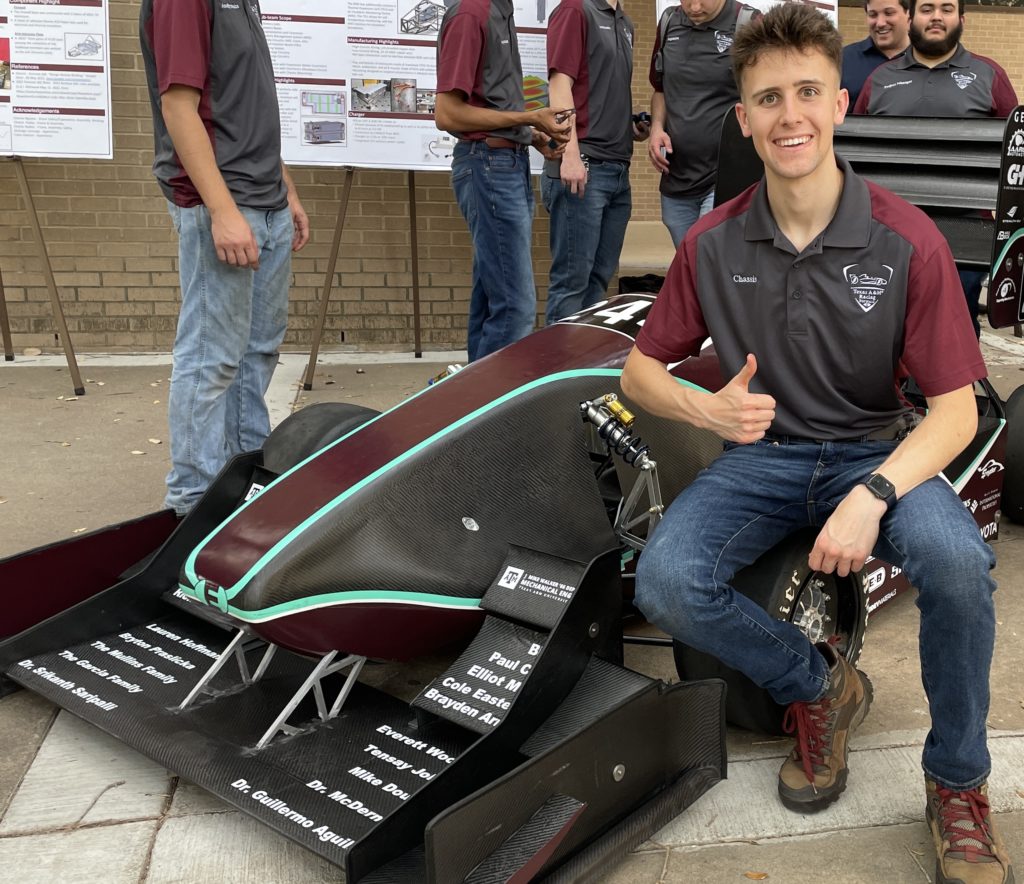
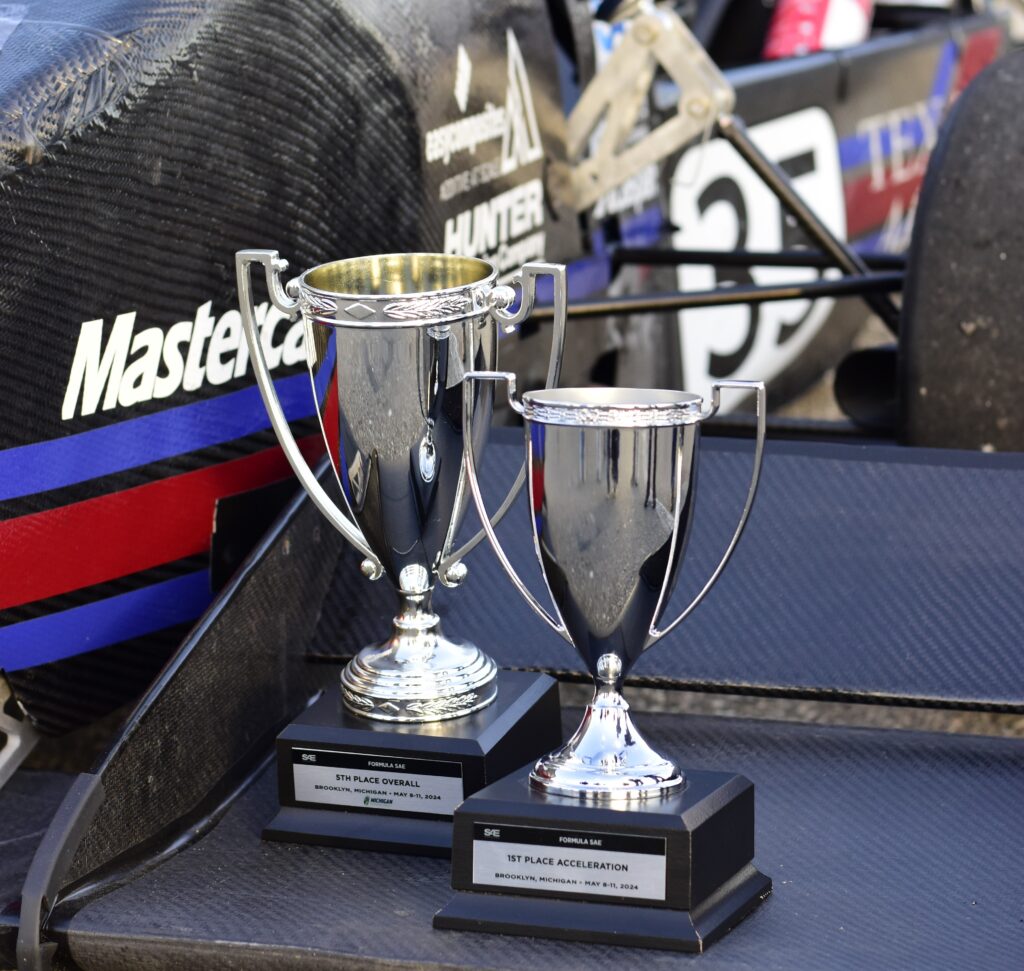
I’m proud to share that these parts achieved this reduction in mass while still maintaining exceptional reliability, with no mechanical failures during full car testing or competition. This achievement allowed us to be the first TAMU FSAE car in three years to complete the endurance event, contributing to the team securing 5th place overall out of more than 100 teams at FSAE Michigan.
Tire and Wheel Selection

Introduction

The tires are the most important component of any racing vehicle; as they are the only way you can transmit controlling forces to the ground. Understanding the importance of this piece of the car, it was crucial that I selected the best tire and wheel package for our application.

Modeling

To begin this process, I needed to model the tires of interest so I could compare their characteristics. The model I chose was a simplified version of the Pacejka Magic Formula. The coefficients of this model are visualized below.

The model was simplified by removing the Curvature Coefficient ‘E’, which improved the R2 value of the fit while reducing model complexity. An example of this model improvement on our chosen tire is shown.

Yaw Moment Diagrams

With the tire models developed, I needed a way to compare the wheel and tire options to see how they would affect the overall handling characteristics of the vehicle. For this, I chose to construct constant skid pad speed (25 mph) Yaw Moment Diagrams using the design specifications of our vehicle for each wheel tire combination.

Example Yaw Moment Diagram of Selected Wheel & Tire Package

These diagrams provide three crucial metrics which can be used to evaluate how the tires will impact cornering performance.

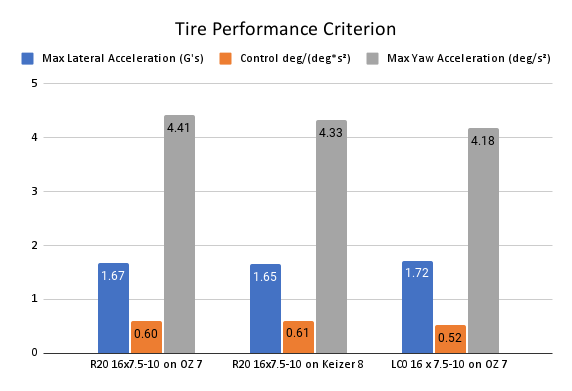
  1. Maximum Lateral Acceleration: Represented by the X coordinate at the left and right extremities where there is no yaw moment on the vehicle, this predicts the maximum lateral g’s the car can hold in steady-state conditions.
  2. Maximum Yaw Acceleration: Represented by the Y coordinate at the upper and lower tips, this predicts the maximum yaw acceleration the vehicle can undergo within grip limits based on the yaw moment created by the tires and the yaw inertia of the vehicle.
  3. Steady State Control: Represented by the Z coordinate at the center of the diagram, this predicts the change in yaw acceleration per change in steering wheel angle and is a good metric of how responsive the vehicle is.

Extracting these datapoints from diagrams created with different wheel and tire combinations allowed me to compare the characteristics of my highest picks for tire and wheel setups. The main tire and wheel combinations I considered were R20’s on 7 inch wide OZ wheels and 8 inch wide Keizer wheels, as well as LC0’s on 7 inch wide OZ wheels.

The inclusion of different wheels proved to be quite important to the performance of the packages as predicted by the diagrams. While the OZ wheels are 28% lighter than the Keizer’s which increases responsiveness by lowering yaw inertia, they have lower cornering stiffness due to their smaller width which decreases responsiveness. Modeling these characteristics together allowed a more complete picture of their effect on the vehicle.

Ultimately, R20’s on OZ 7-inch wide wheels were chosen for this year’s vehicle. Though they don’t have the highest levels of max lateral acceleration or cornering control, they offered a good balance of these characteristics by being a close second for both of these metrics. They also showed the highest maximum yaw acceleration of the setups, very useful on the tight corners often found on FSAE tracks.

Other Factors

Another reason for the selection of the OZ wheels over TAMU’s typical selection of Keizer’s is the significant saving in manufacturing time and complexity at no cost penalty. This is because the OZ’s come as a single-piece wheel where Keizer sells wheel outers which need to be joined to custom wheel centers. When considering the cost of the high strength aluminum that would need to be purchased for these wheel centers, both wheels cost ~$350. The single-piece construction, however, reduces system complexity and saves the team ~40 hours of precision CNC machining time.

Another factor that was considered for the selection of the R20 was pre-season testing, where the drivers found the LC0 compound to be much less predictable than R20’s when using them on real track surfaces. Though this compound performed well once warmed up and scrubbed, they quickly dropped off as they wore down, or got out of their temperature envelope

Tire Characterization

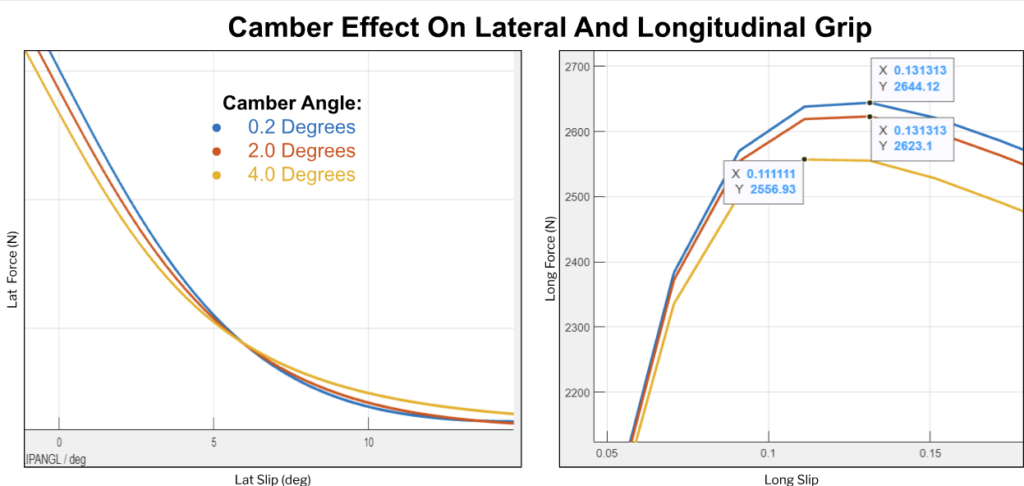
With the wheel and tire package selected, I needed to figure out the best way for the suspension system to orient the tires for maximum performance. The first thing I looked at was camber angles.

As seen in the plots above, increasing camber improves cornering stiffness somewhat linearly, but this comes at the expense of limit cornering grip and longitudinal grip. Noting the large 2.5% drop in longitudinal grip between 2 and 4 degrees of camber, especially relevant with this year’s powerful 4-cylinder powertrain, I worked with the kinematics designer to keep the wheel in the range of 0.2 to 2.0 degrees of camber throughout wheel travel.

Another characteristic I inspected was tire temperature.

From this plot, it can be seen that the highest coefficients of friction occur between 131-138 Degrees F. Knowing this, we could adjust our camber angles on track to keep the tires in their best operating envelope.

Results

Ultimately this wheel and tire selection was 20% lighter than the previous team’s package, contributing to the lightest TAMU FSAE suspension system ever created, and allowed the vehicle to reach over 1.8 G’s of lateral acceleration on track.

This performance, combined with the system’s reliability to give our drivers ample practice time, contributed to the team’s success at competition; earning 5th in skidpad and 5th overall out of over 100 teams at FSAE Michigan.
Lifter Belt Guard Improvements

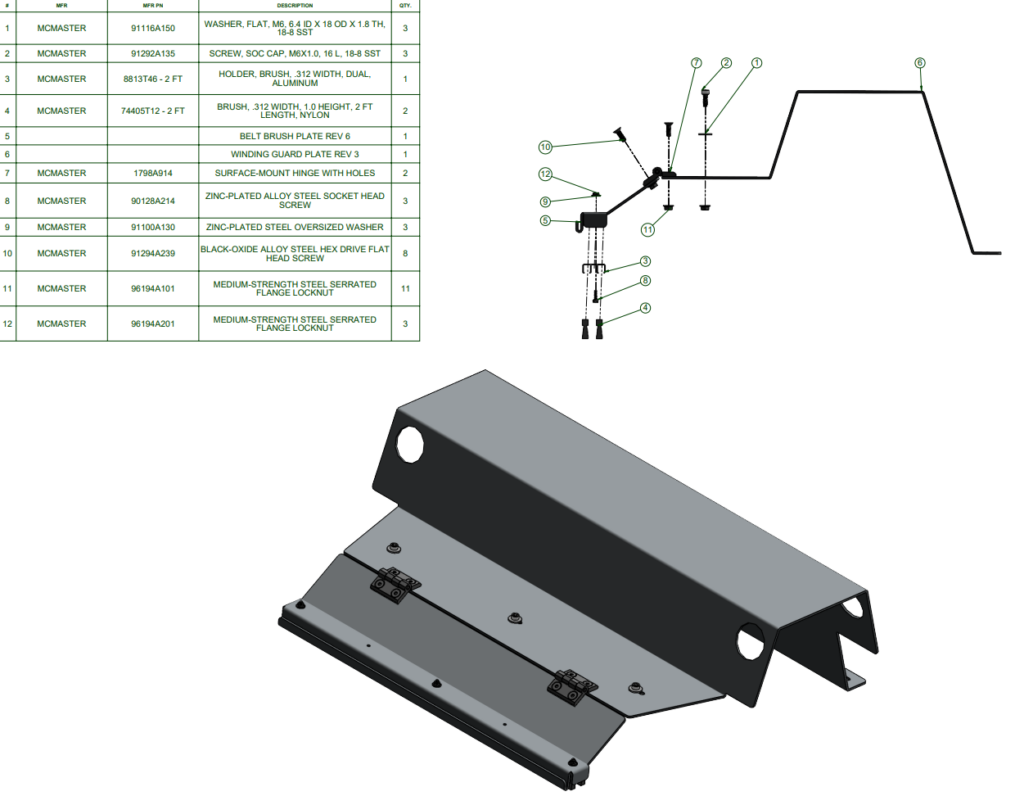
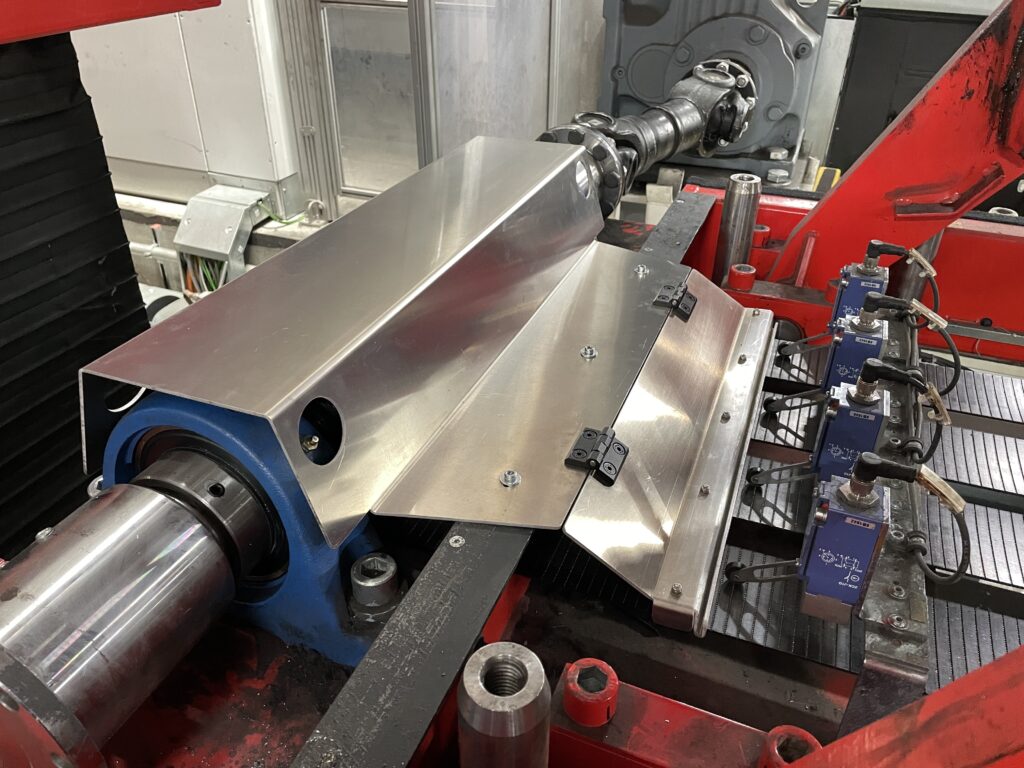
Tesla used sheet metal guards to protect the vehicle lifter belts from being punctured by bolts. One of my later tasks was to improve these guards’ design and prepare documentation to make them for all the lifters.

Original Guard
IssueImprovements
Needed to be removed to grease roller bearingsAccessibility holes added to the upper structure
Small hinge hardware was easily dropped or misplacedless bolts used on hinges, increasing their size
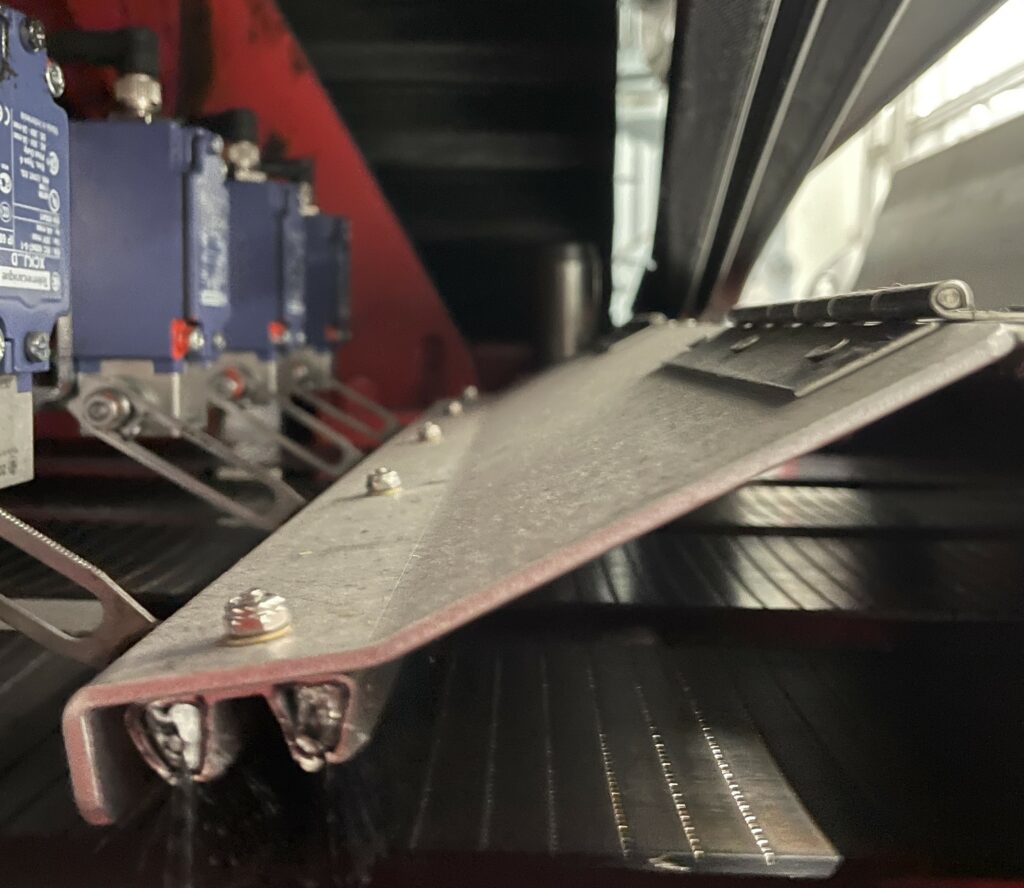
Sharp, downward leading edge caused belt wear hazardHemmed leading edge and increased front plate height to allow brushes to lay flat

To implement these changes, I redesigned the part in CAD, found the necessary hardware to assemble the structure, documented everything using part drawings, and commissioned the fabrication of two sample guards from local fabricators.

Assembly Drawing
Fabricated and installed guard

With the guard installed, I needed to test it to ensure there were no clearance issues or possibilities of excess friction flipping the leading edge back. After running the lifter through three cycles under close inspection during a shutdown, the team felt confident deploying it for production.

Clearance Testing

Despite the small clearance in the front, necessary to block the tip of chamfered bolts, this iteration of the guard saw no issues during my time at Tesla. With the documentation I created for this part, my team was prepared to order these for every lifter.
Brake System Design

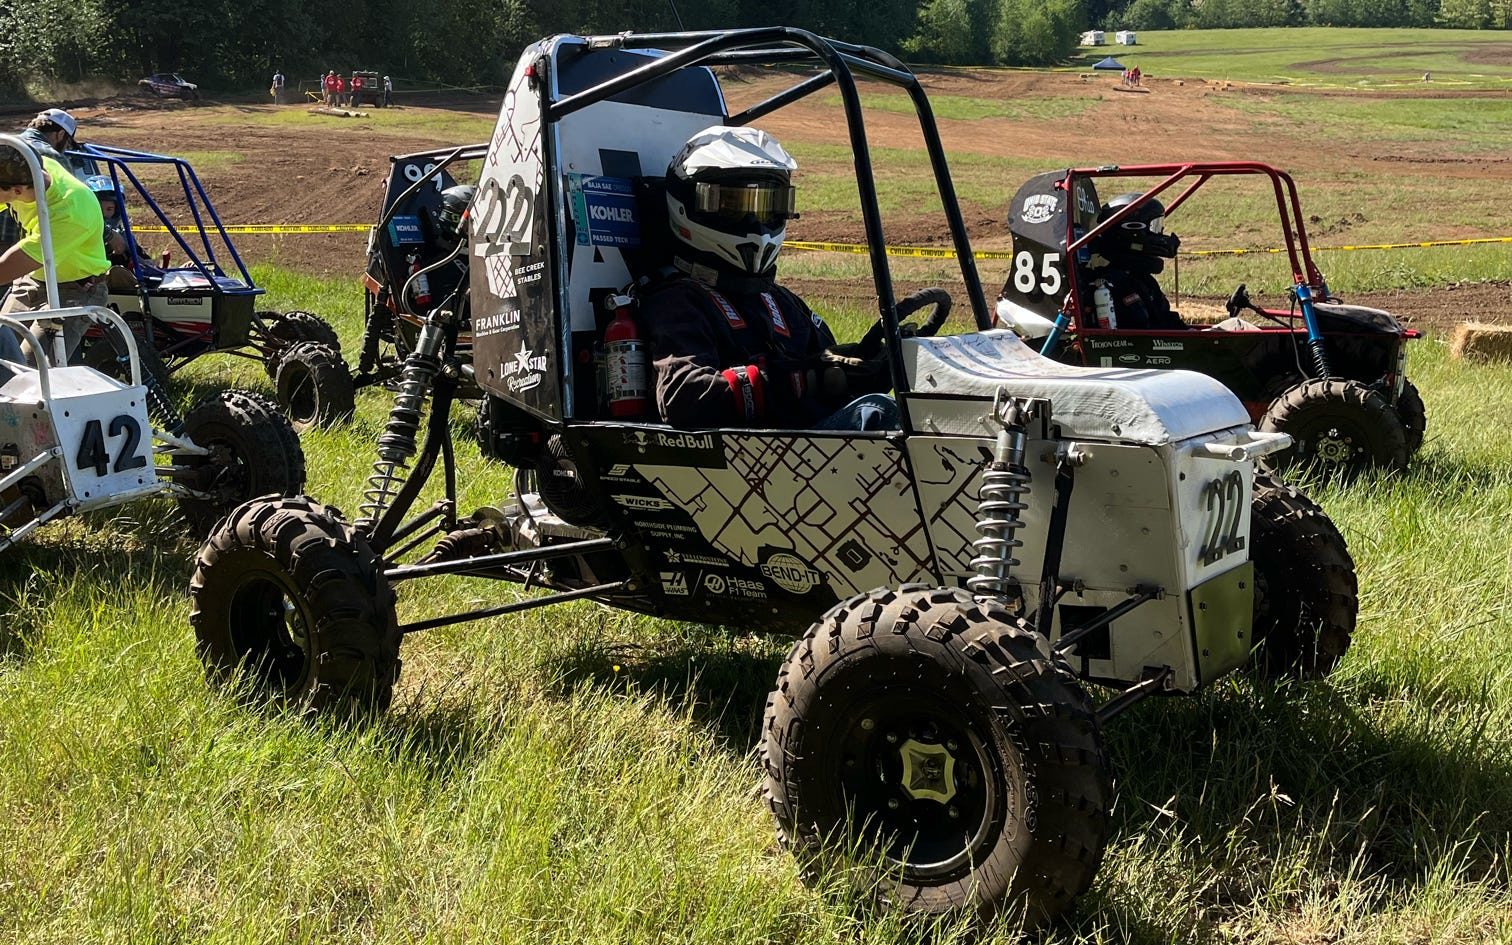
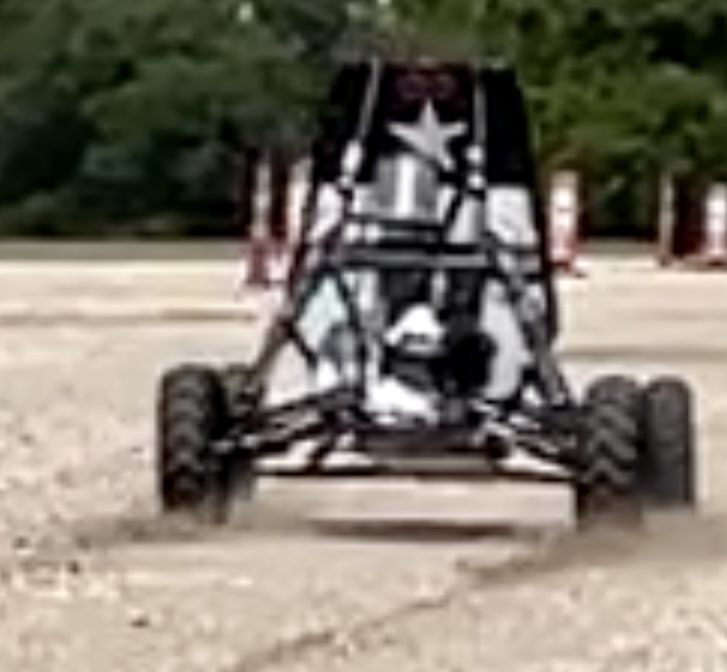
2023 SAE Baja Car at Endurance After Passing Brake Check

Introduction

As the sole brakes engineer for TAMU Baja, I designed, manufactured, and tested a reliable, lightweight braking system for use in the 2023 vehicle.

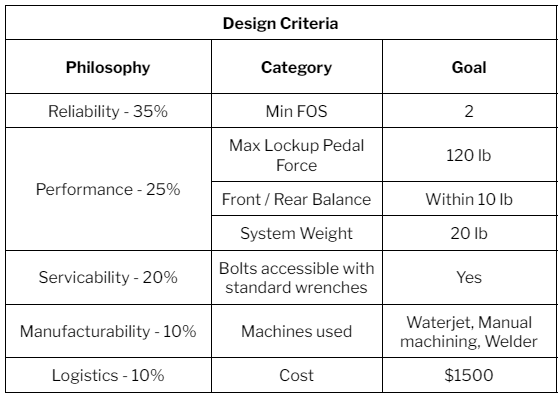
Design Philosophy

At the beginning of the season, I helped establish a design philosophy to guide all team members as they make engineering compromises throughout the season.

Throughout the season, I referenced this guide to ensure I was creating a system in accordance with the agreed-upon vision for the car.

Braking Force Calculations

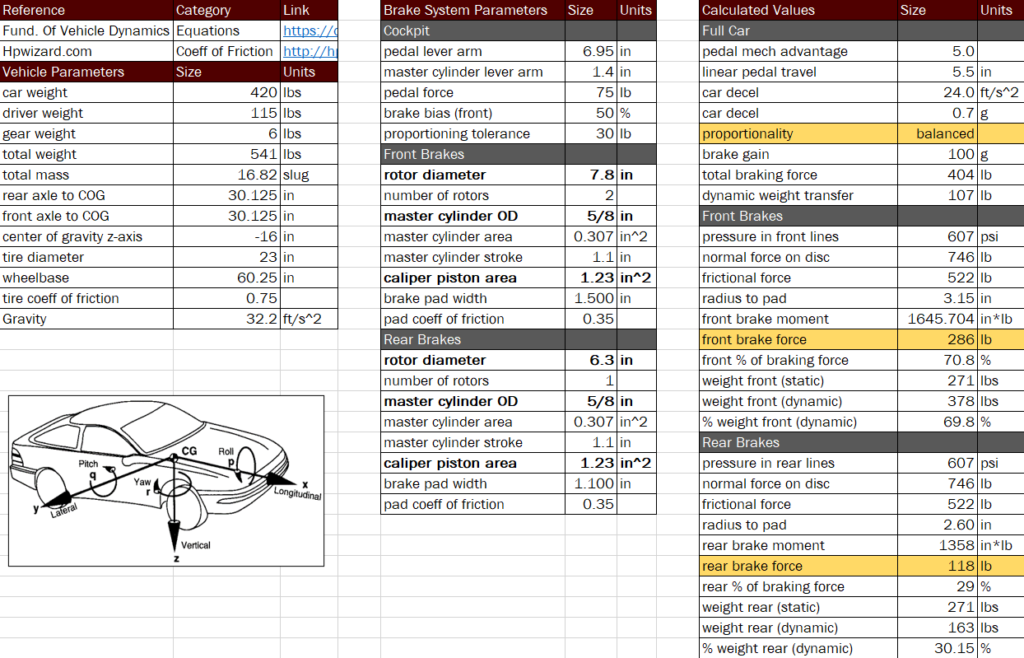
As the balance and strength of the braking system are a product of many design choices, I constructed an Excel Braking Calculator to ensure my design would be able to lock all four tires as I experimented with design changes.

Braking Force Calculations

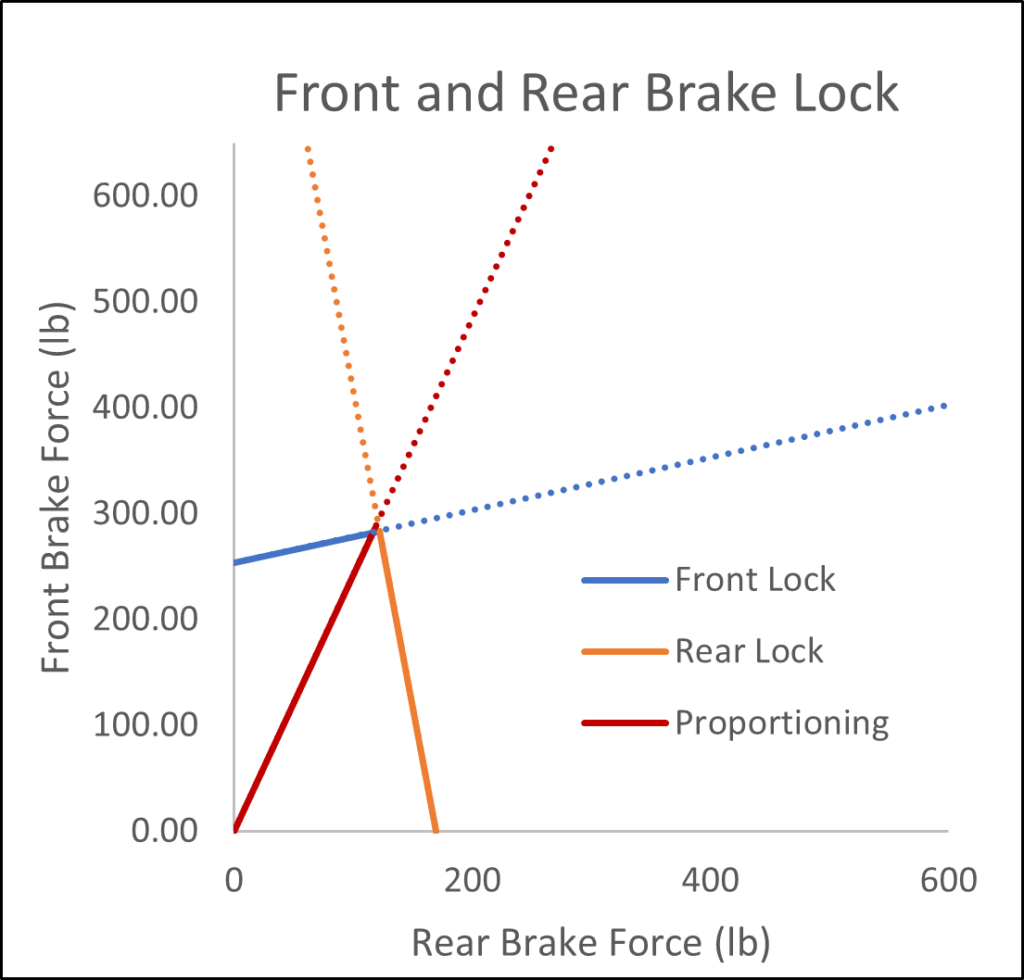
From the data shown above, the calculator would create a brake proportioning plot.

Brake Proportioning Plot

As the brake designer, my objective is to design a system that is balanced such that the ‘Proportioning’ line points straight at the intersection of the ‘Lock’ lines. As well, it must provide enough mechanical advantage so a driver can reach this wheel lock with reasonable pedal force.

To help understand how to read these figures, some examples of proportioning plots for different systems are shown below.

Pedal Configuration

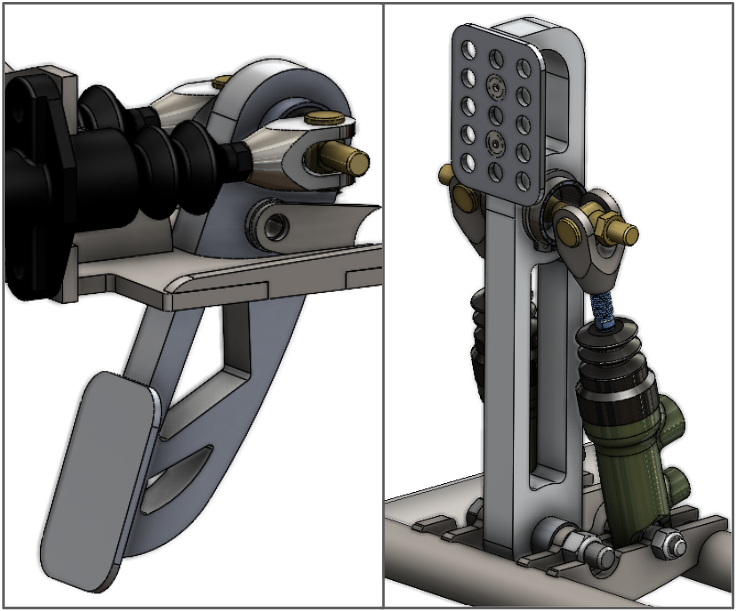
For the brake pedal configuration, I considered two main options: top mounted with linear master cylinders, and bottom mounted with pivoting master cylinders.

Top and Bottom Mounted Pedal Configurations

To help me choose between these, I constructed a decision matrix based on the overall team design philosophy. In this matrix, categories that could be numerically justified such as Mass, CG, and Logistics (which was based on cost) had normalized scores based on sample designs for each configuration. Other scores were chosen based on empirical research and intuition.

Pedal Configuration Decision Matrix

As shown, the matrix resulted in the selection of a bottom-mounted pedal.

Component Selection

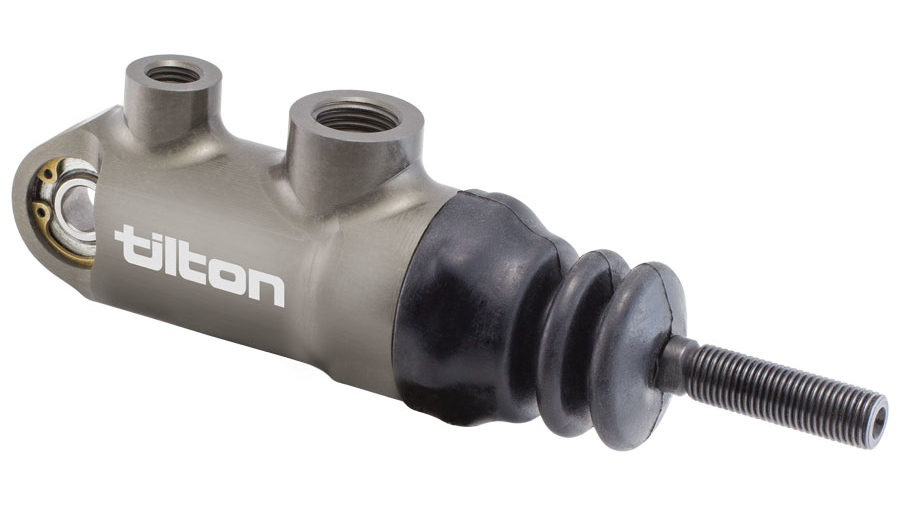
The selection of master cylinder model was quite easy, as options for pivoting master cylinders required by my design are limited. Ultimately, the Tilton 78-Series master cylinders were chosen for their quality and availability of product information.

Tilton 78-Series Master Cylinder

The calipers chosen were the Wilwood GP200. These were preferred to the PS-1 calipers used by previous teams because they were lighter and offered larger bore diameter options.

Wilwood GP200 Caliper

For the selection of master cylinder and caliper bore diameters, I chose the smallest master cylinder diameter and largest piston bore diameter to maximize my hydraulic advantage. This allows me to reduce the size of my pedal and rotors for easier packaging while still maintaining sufficient braking strength.

Rotor Thermal Simulations

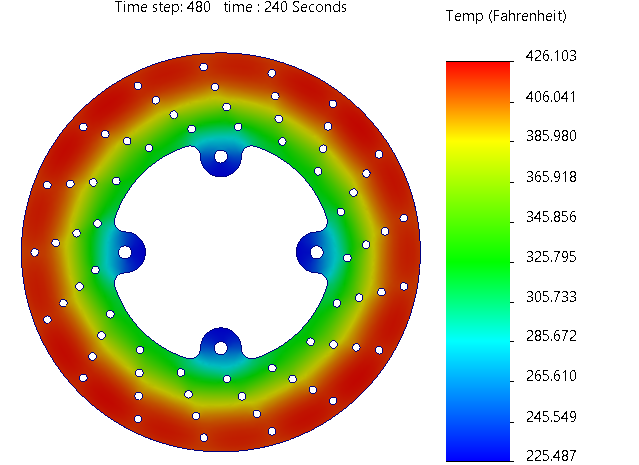
Because the frictional coefficient of the brake pads, and consequently braking force, is dependent on temperature, I performed some thermal simulations to estimate my rotor temperature (roughly equal to the pad temperature).

Simulated Thermal Distribution

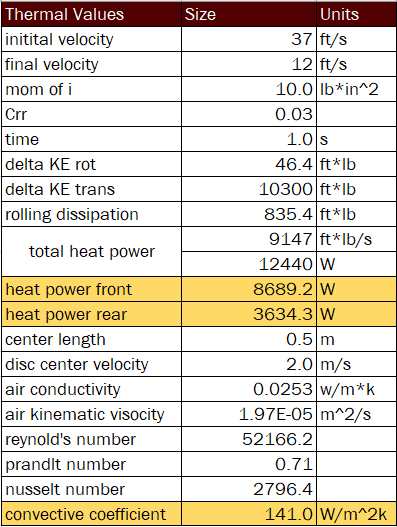
For these simulations, I calculated the heat power needed to slow the car from straight-line speed to cornering speed based on the linear and angular momentum change from this deceleration, then subtracted the work done by rolling resistance. To estimate the convective coefficient, I used a flat-plate correlation equation from “The Fundamentals of Heat and Mass Transfer” along with the average center velocity of the disc. The bulk temperature was chosen to be 60 Fahrenheit based on typical weather in Woshugal MX Park where the vehicle would compete. Finally, I found the time required to perform this deceleration based on my braking force calculations.

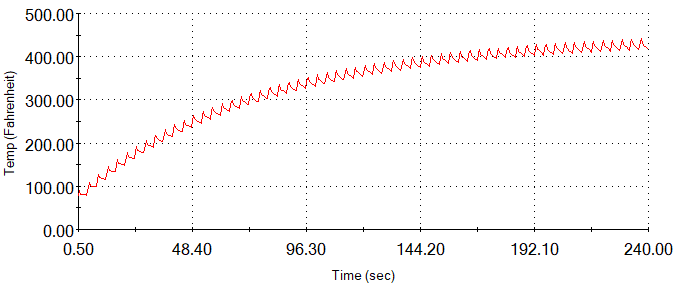
For the numerical simulation, I applied the heat power for the time needed to slow the car and allowed 5-second cooling intervals between. I then selected a node in the friction surface region to generate a Temperature Vs Time Curve. In this plot, the friction surface converges to a temperature of approximately 420 Fahrenheit.

Simulated Rotor Temperature Over Time

Although many assumptions were made for this simulation, my resulting coefficients and temperatures were all within a reasonable range based on other thermal simulations and tests of Baja SAE brakes.

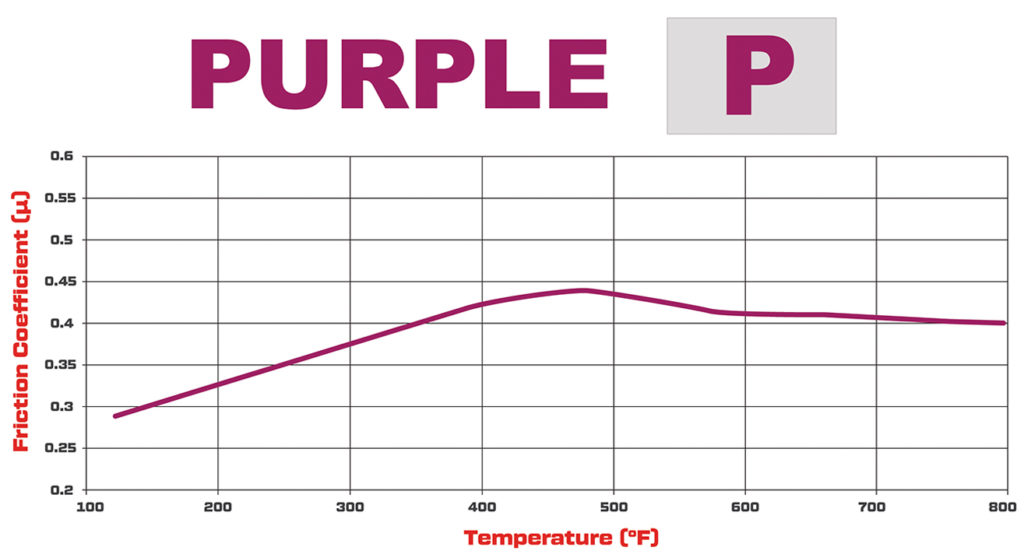
Comparing the convergence temperature of 420 Fahrenheit with the Friction Coefficient Vs Temperature data for my selected brake pad suggested that I could nearly maximize the friction potential

Friction Coefficient Vs Temperature of My Chosen Brake Pad

Manufacturing & Testing

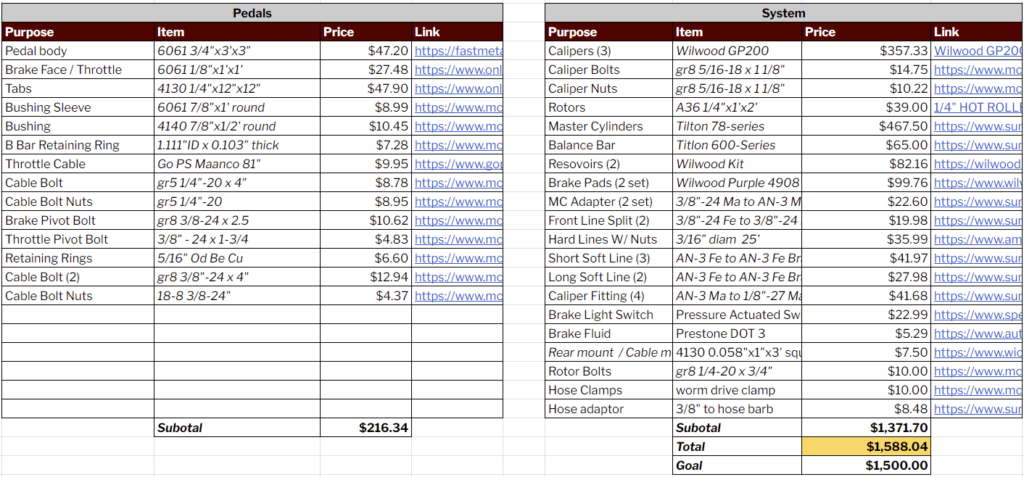
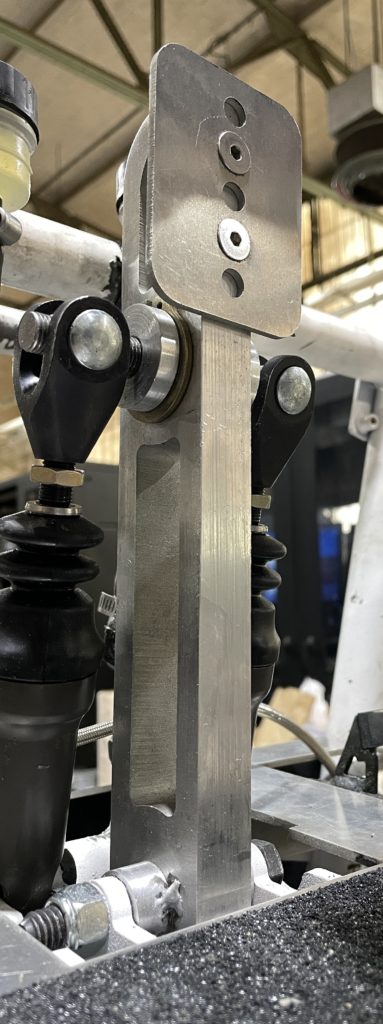
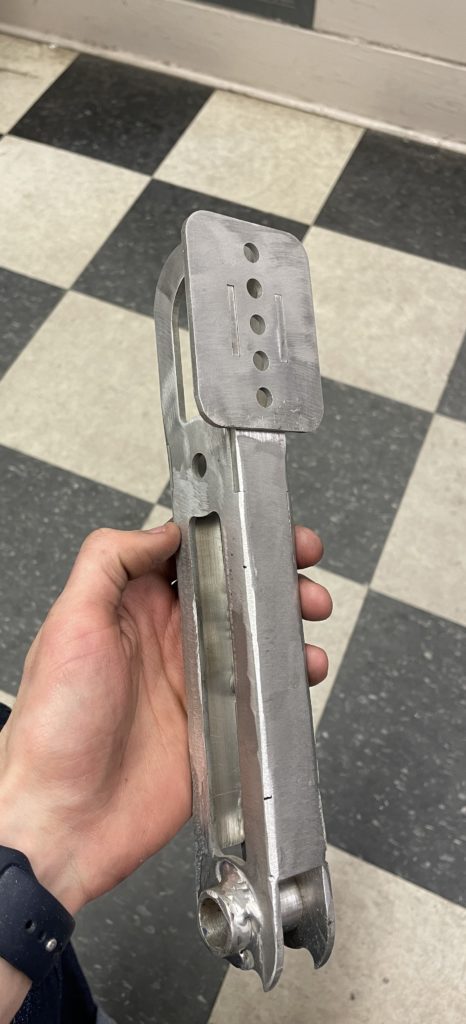
Brakes BOM
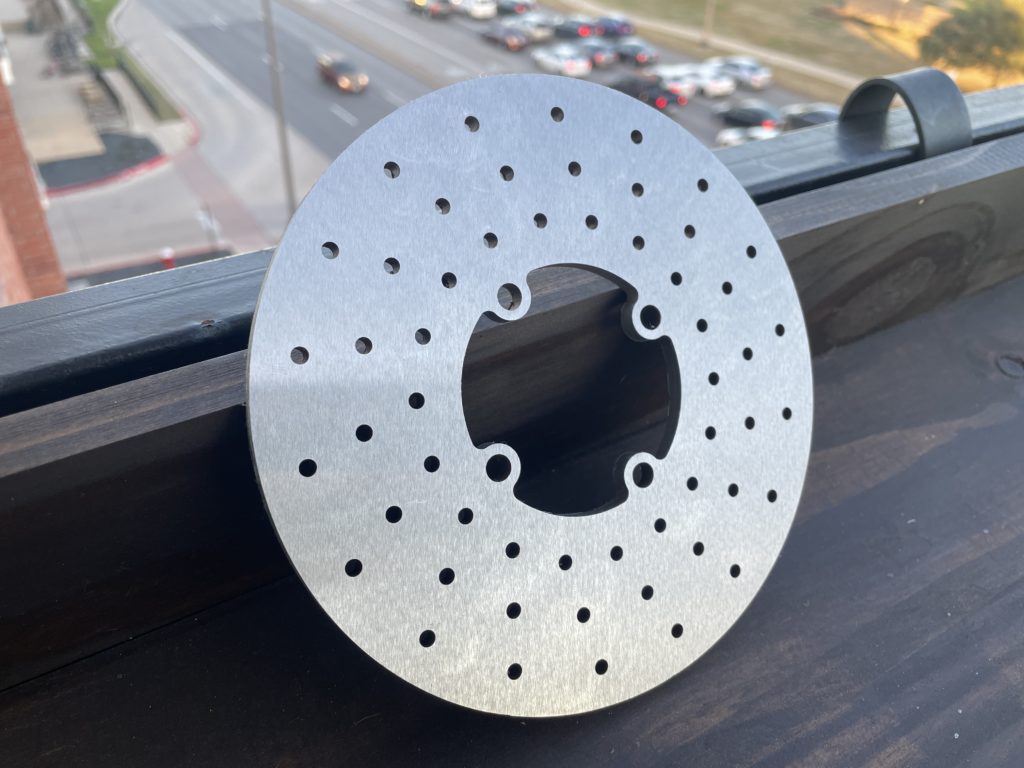
Waterjet and Surface Ground Brake Rotor
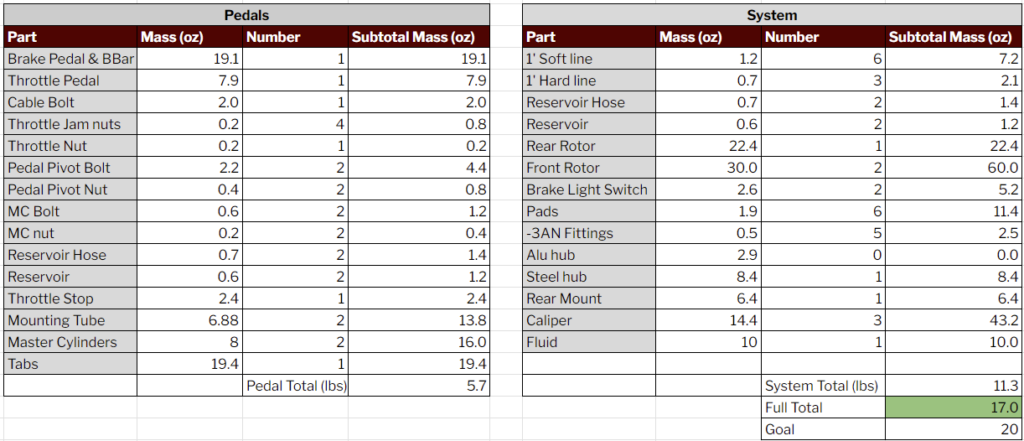
Weight Tracking
All Wheels Locking at Initial Testing
Successfully Passing Brake Tech on First Attempt

Off Road Suspension Force Calculations

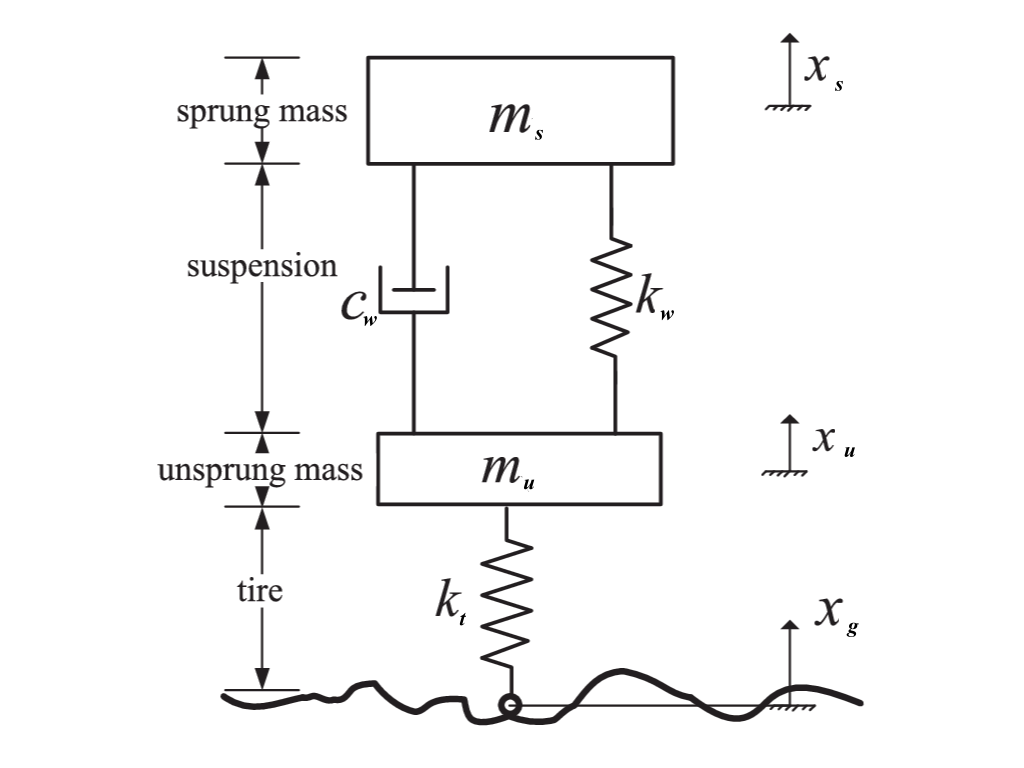
After a promising review of my braking system design during the SAE Baja design season, the team leaders saw my potential for further involvement. They entrusted me with a crucial task: analyzing the forces within the suspension links to assist the designers. I tackled this challenge head-on with a methodical approach, First simplifying the suspension system of each corner into a quarter-car model.

Quarter Car Model

From this model, I developed a free-body diagram (FBD) and equations of motion (EOMs) for each suspension corner.

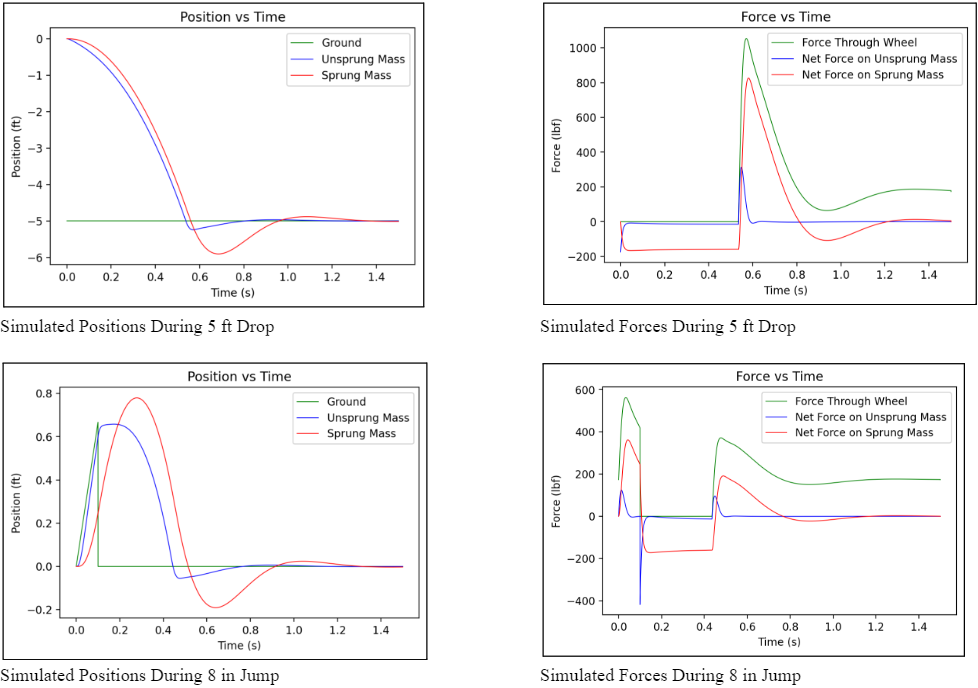
I then wrote a Python script that implemented Euler integration to solve these EOMs, determining the position of both sprung and unsprung masses at each time step. This, in conjunction with the tire’s spring rate, allowed for the calculation of forces exerted on the wheel under various bump scenarios.

While time and budget constraints within the Baja SAE competition made physical testing of my code before vehicle design impossible, I was committed to achieving meaningful validation. To do so, I sought the expertise of Chris Bachman from Cal State, who had previously conducted similar calculations for a Baja SAE vehicle and successfully correlated them with strain gauge testing. His results demonstrated a strong agreement between calculated and measured forces on the track, providing a valuable benchmark. To establish consistency with his findings, I ran a simulation using the vehicle parameters from his research, yielding similar results. This cross-validation, even in the absence of direct physical testing, instilled confidence in the accuracy and reliability of my code.

Having established the wheel forces, the next step was to dissect their distribution through individual suspension links. To accomplish this, I employed Skyciv, a structural analysis software.

Skyciv Structural Model

Despite its primary application in civil engineering, Skyciv’s low solve time and ease of setup for 1D beam elements made it well-suited for finding the stress distribution throughout the suspension system as a whole.

The resulting force data at each pickup point allowed the suspension designers to execute solid body FEA (Finite Element Analysis). This validated the strength of their links and informed their design decisions, ultimately contributing to the team’s success in the Baja SAE competition.

Chassis Design

Introduction

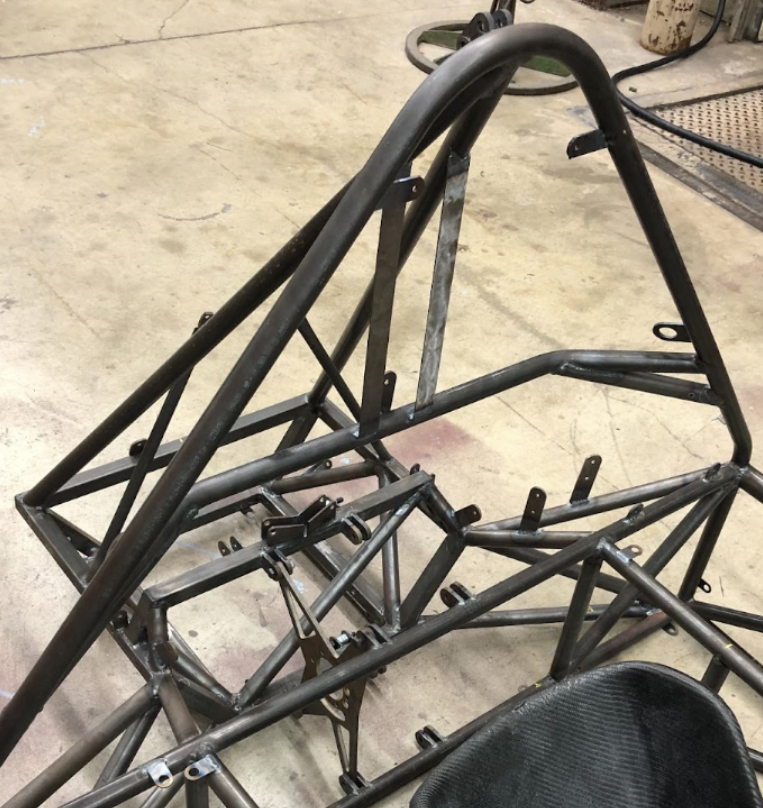
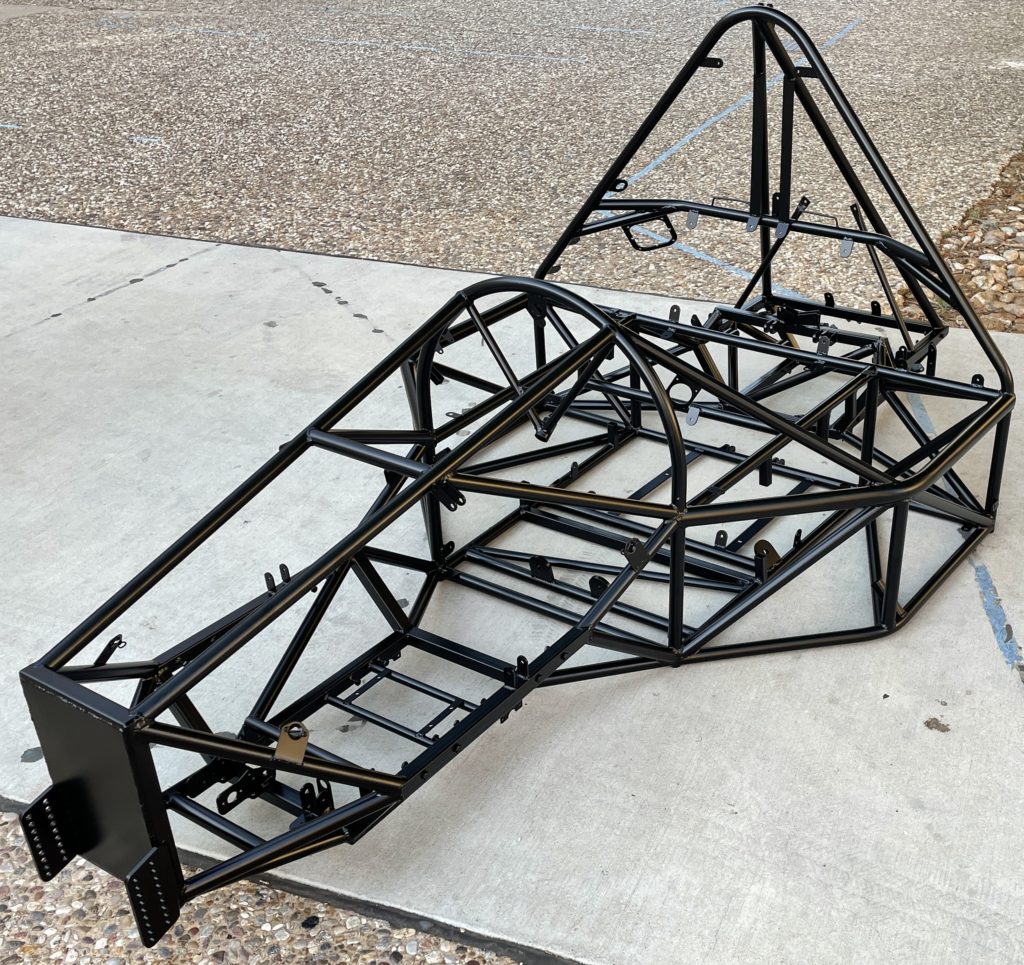
For my first season on an FSAE team, I was able to contribute as a chassis engineer. During that season, my subteam and I defined our engineering needs, made design choices accordingly, and successfully manufactured and validated our design through real-world testing.

Need Statement

“A readily adaptable, cost-effective chassis that will optimize rigidity and weight.”

High-Level Design Choices

For the vehicle chassis, a few defining decisions had to be made at the beginning of the design cycle. These choices included the configuration and material.

Configuration: Spaceframe

Frame Configuration Decision Matrix

Material: 4130 Chromoly Steel

Material Decision Matrix

Torsional Rigidity

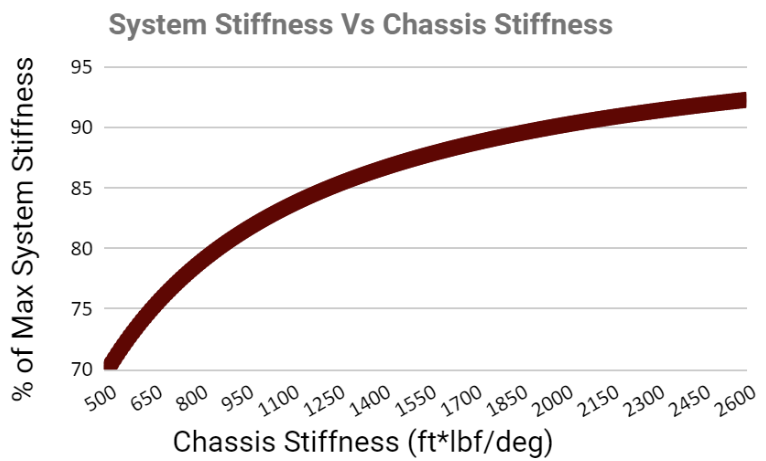
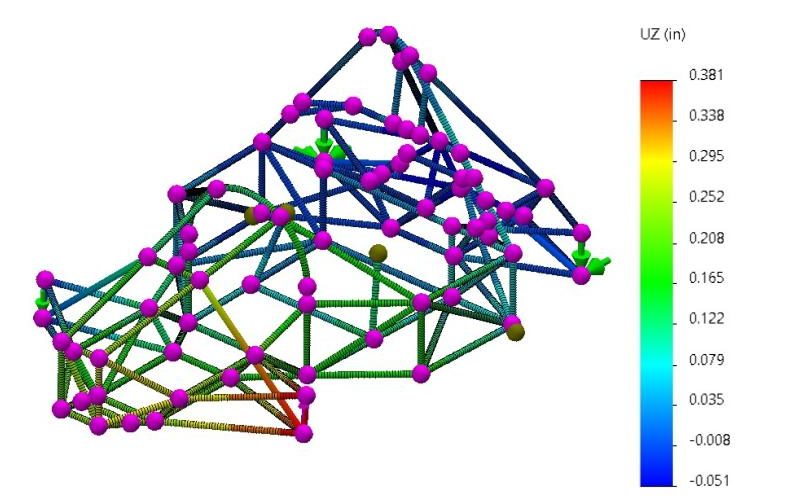
As seen in the plot, there is a point of marginal returns where it is not necessary to increase the chassis stiffness further. This occurs around 90% of full vehicle stiffness or 1960 lb*ft/deg chassis stiffness, which was chosen as our rigidity goal.

Torsional Rigidity FEA Setup

Manufacturing and Validation

Welding Jig.

Simulation Validation

Physical testing gave a torsional rigidity of 2307 ft*lb/deg, representing only a 2% error from the simulation’s prediction.

Outcomes

Although this frame did become somewhat heavy from the extra frame members required to house the team’s dual-battery system, it was extraordinarily rigid which allowed the suspension team to precisely tune their setup. As well, its ability to accommodate this unique battery was rewarded by the design judges; helping the car place in the top third of teams in the design event in TAMU’s first year competing in this category.

Learnings

With this being my first major collegiate design project, it is nearly impossible to summarize the amount of hands-on engineering knowledge I gained from this experience. Beyond all the engineering drawings, fastener types, and manufacturing processes, I learned something much deeper from this design: how to manage an engineering project in the real world. With no rubric or answer key to fall back on, me and my team had to decide what the best answers were for ourselves and be confident enough to follow through with them.

Installation Trolleys

Introduction

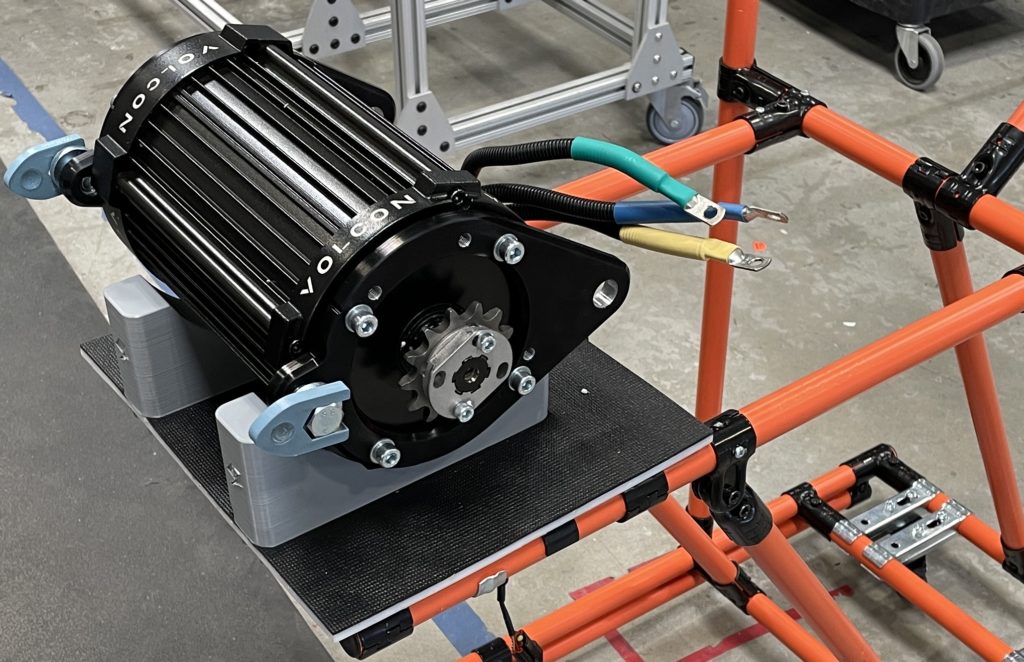
During my time at Volcon, there was a need to improve the installation process of motors and swingarms on the Grunt motorcycles. To address this need, I took it upon myself to develop installation trolleys that would improve these processes.

Requirements

  • Carry a 40 lb motor 10 feet from the storage rack to the frame jig
  • Be compatible for part installation with Volcon’s existing frame jig
  • Eliminate any pinch hazard during the installation process
  • Decrease risk of frame damage during part installation

Brainstorming

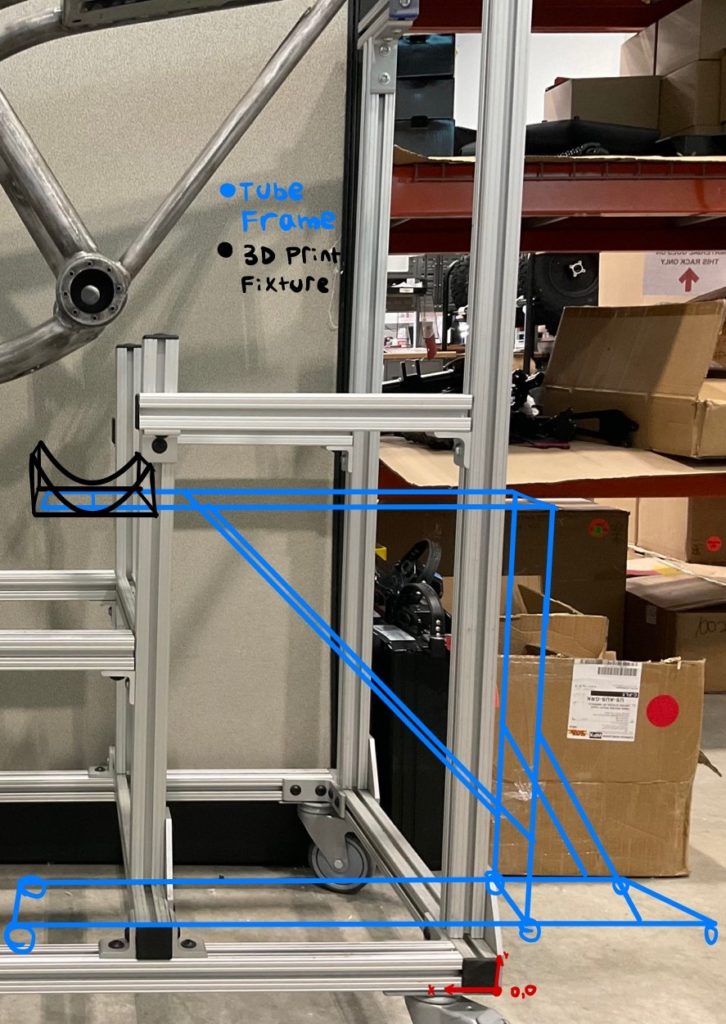
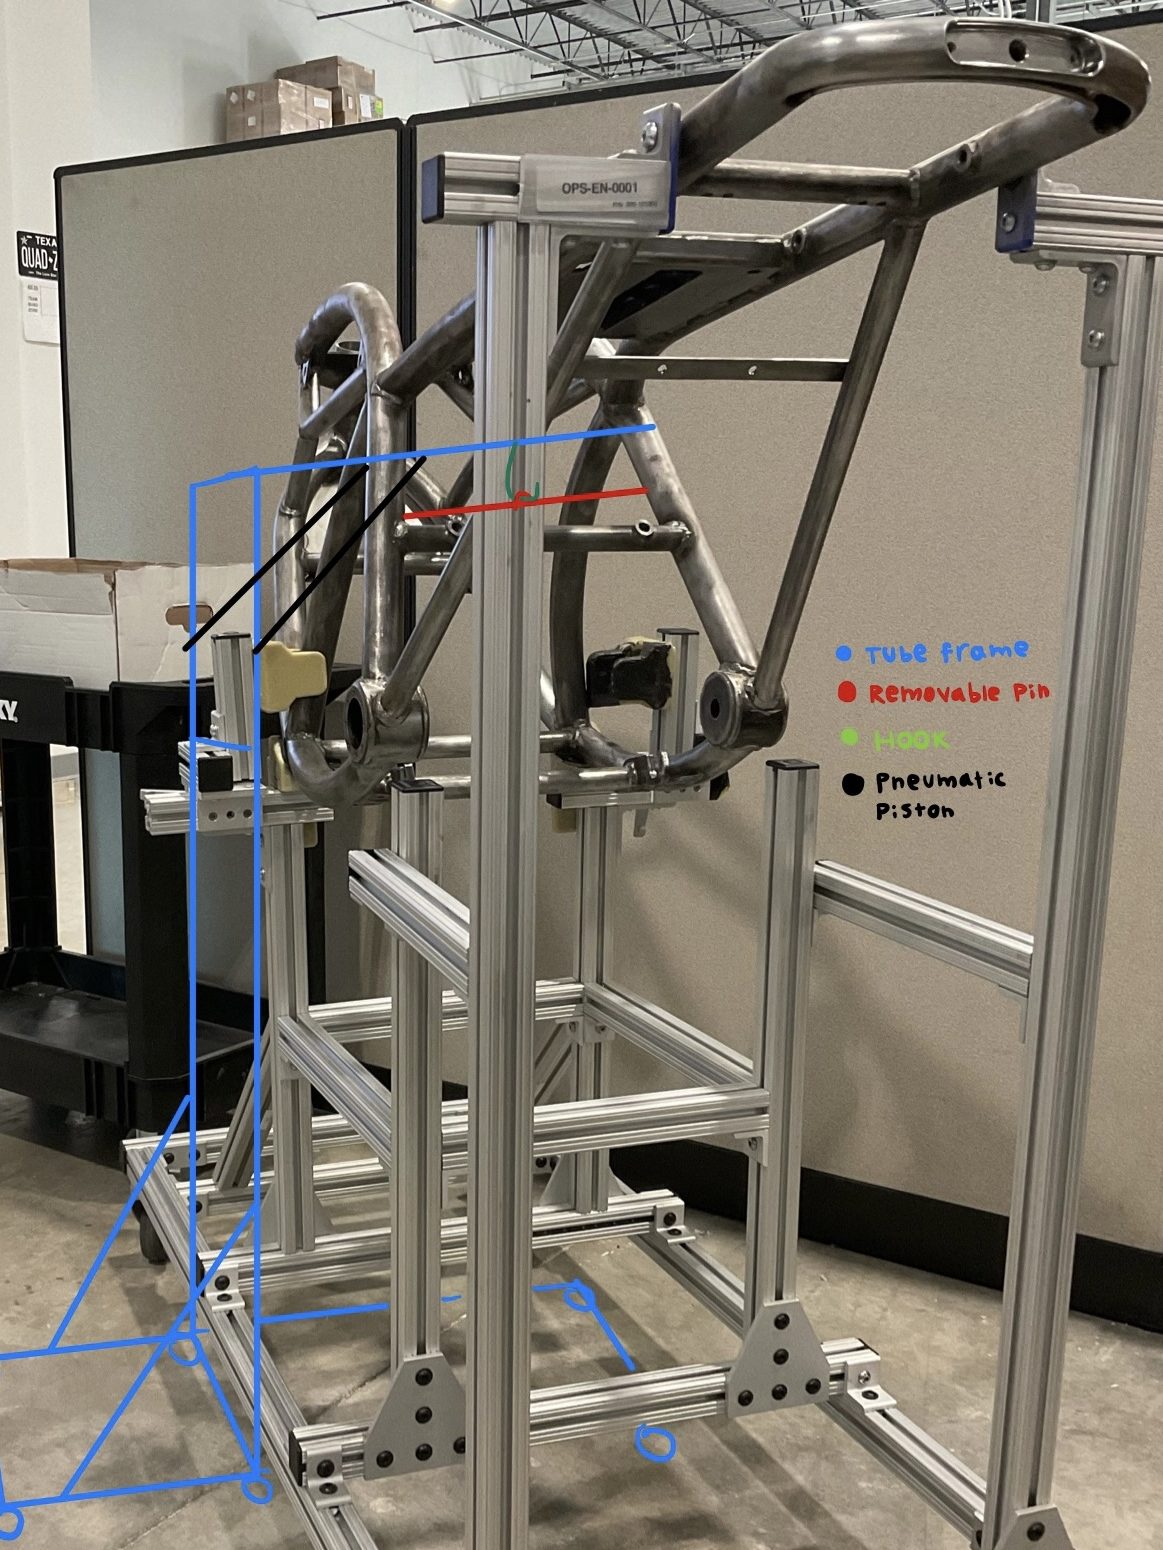
With the requirements identified, I did some brainstorming to come up with possible designs to fulfill them. Sketches of the two main concepts are shown below.

After some consultation with fellow production engineers, I decided to move forward with the rear-installation configuration because of its simplicity and cheapness, and favorable packaging.

Trolley Frame

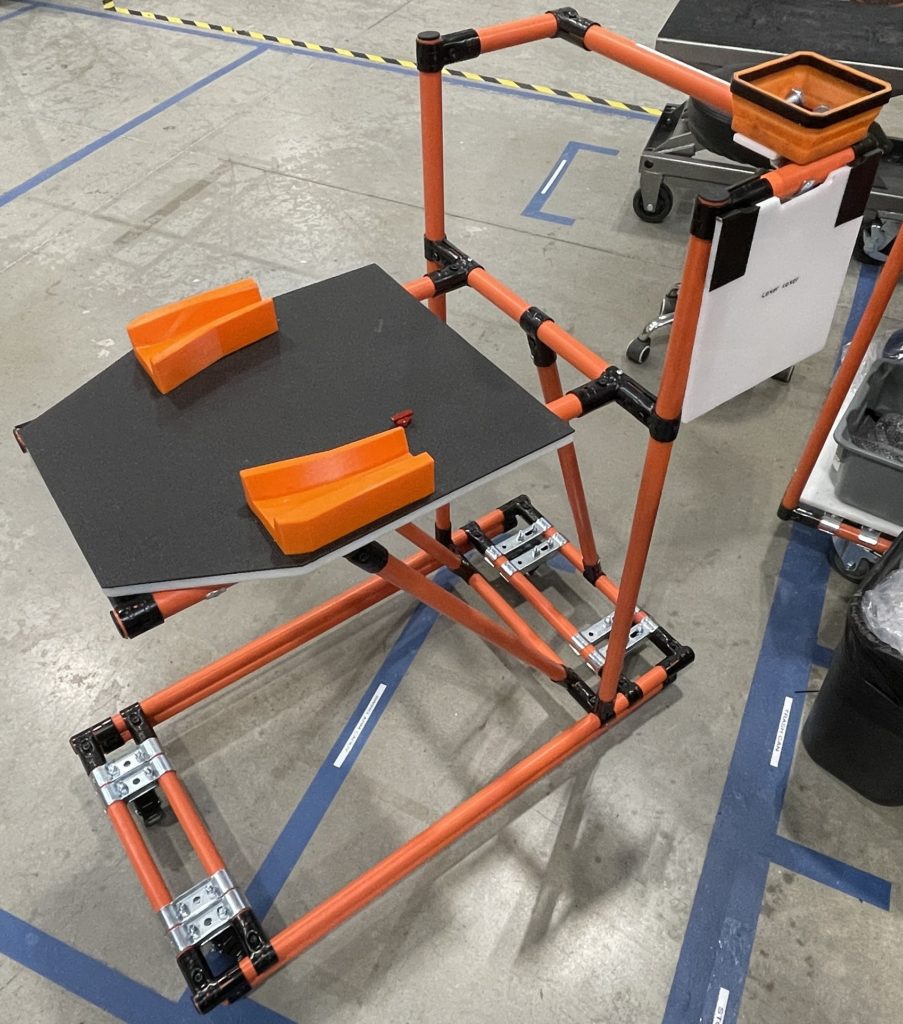
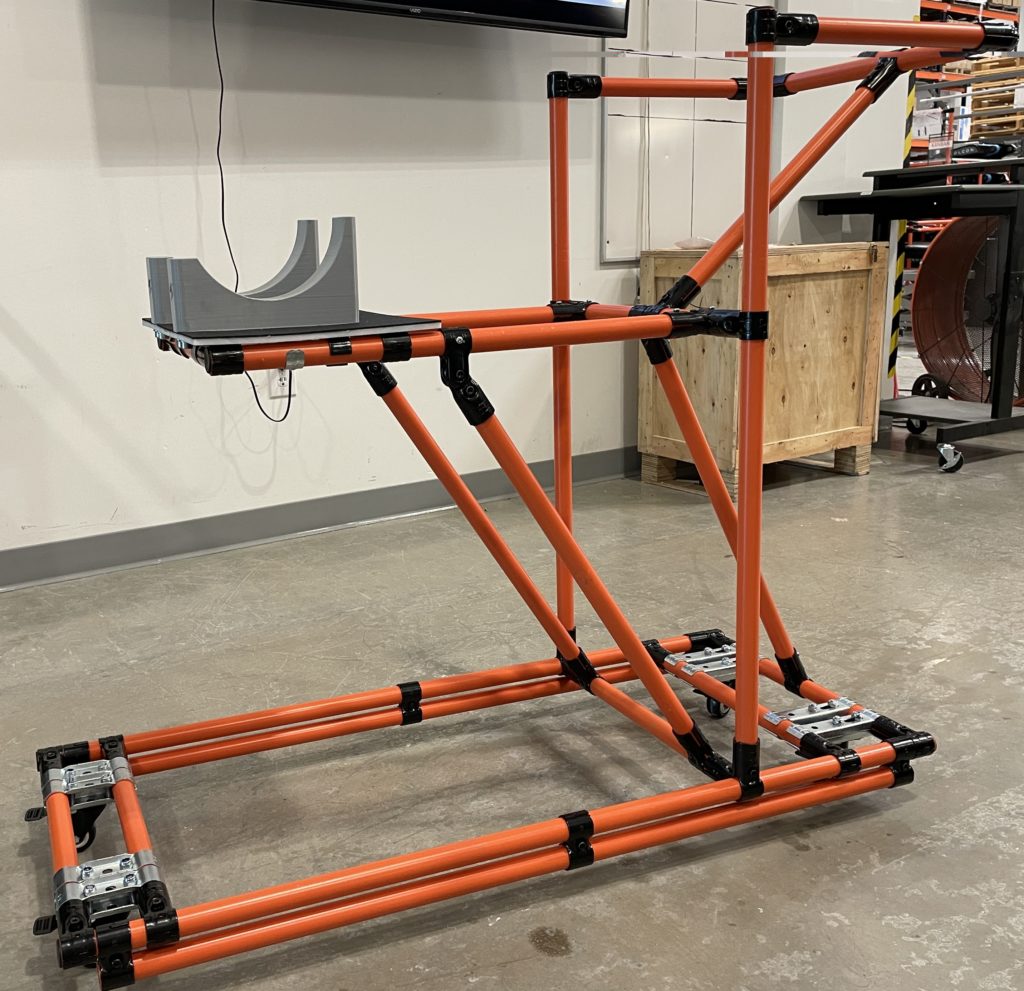
I chose to use a Flexpipe tubing structure for the frame of the cart because it is cheap, easy to assemble, and allows for modification of the structure even after construction.

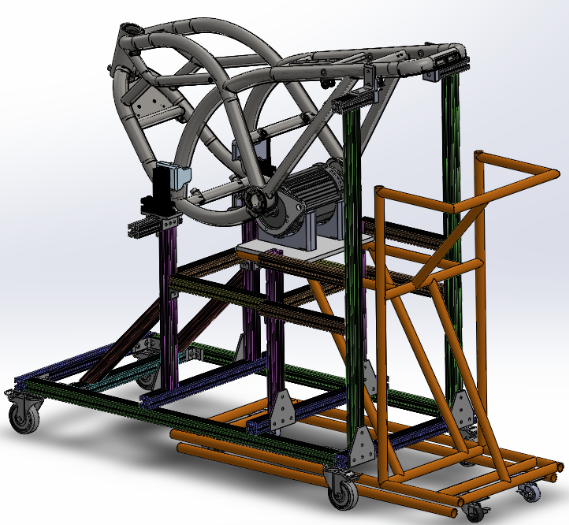
To model the frame, I used Solidworks Weldments to create a part within the context of the Grunt Frame Trolley assembly.

Solidworks Model of Trolley With Stiffened Frame

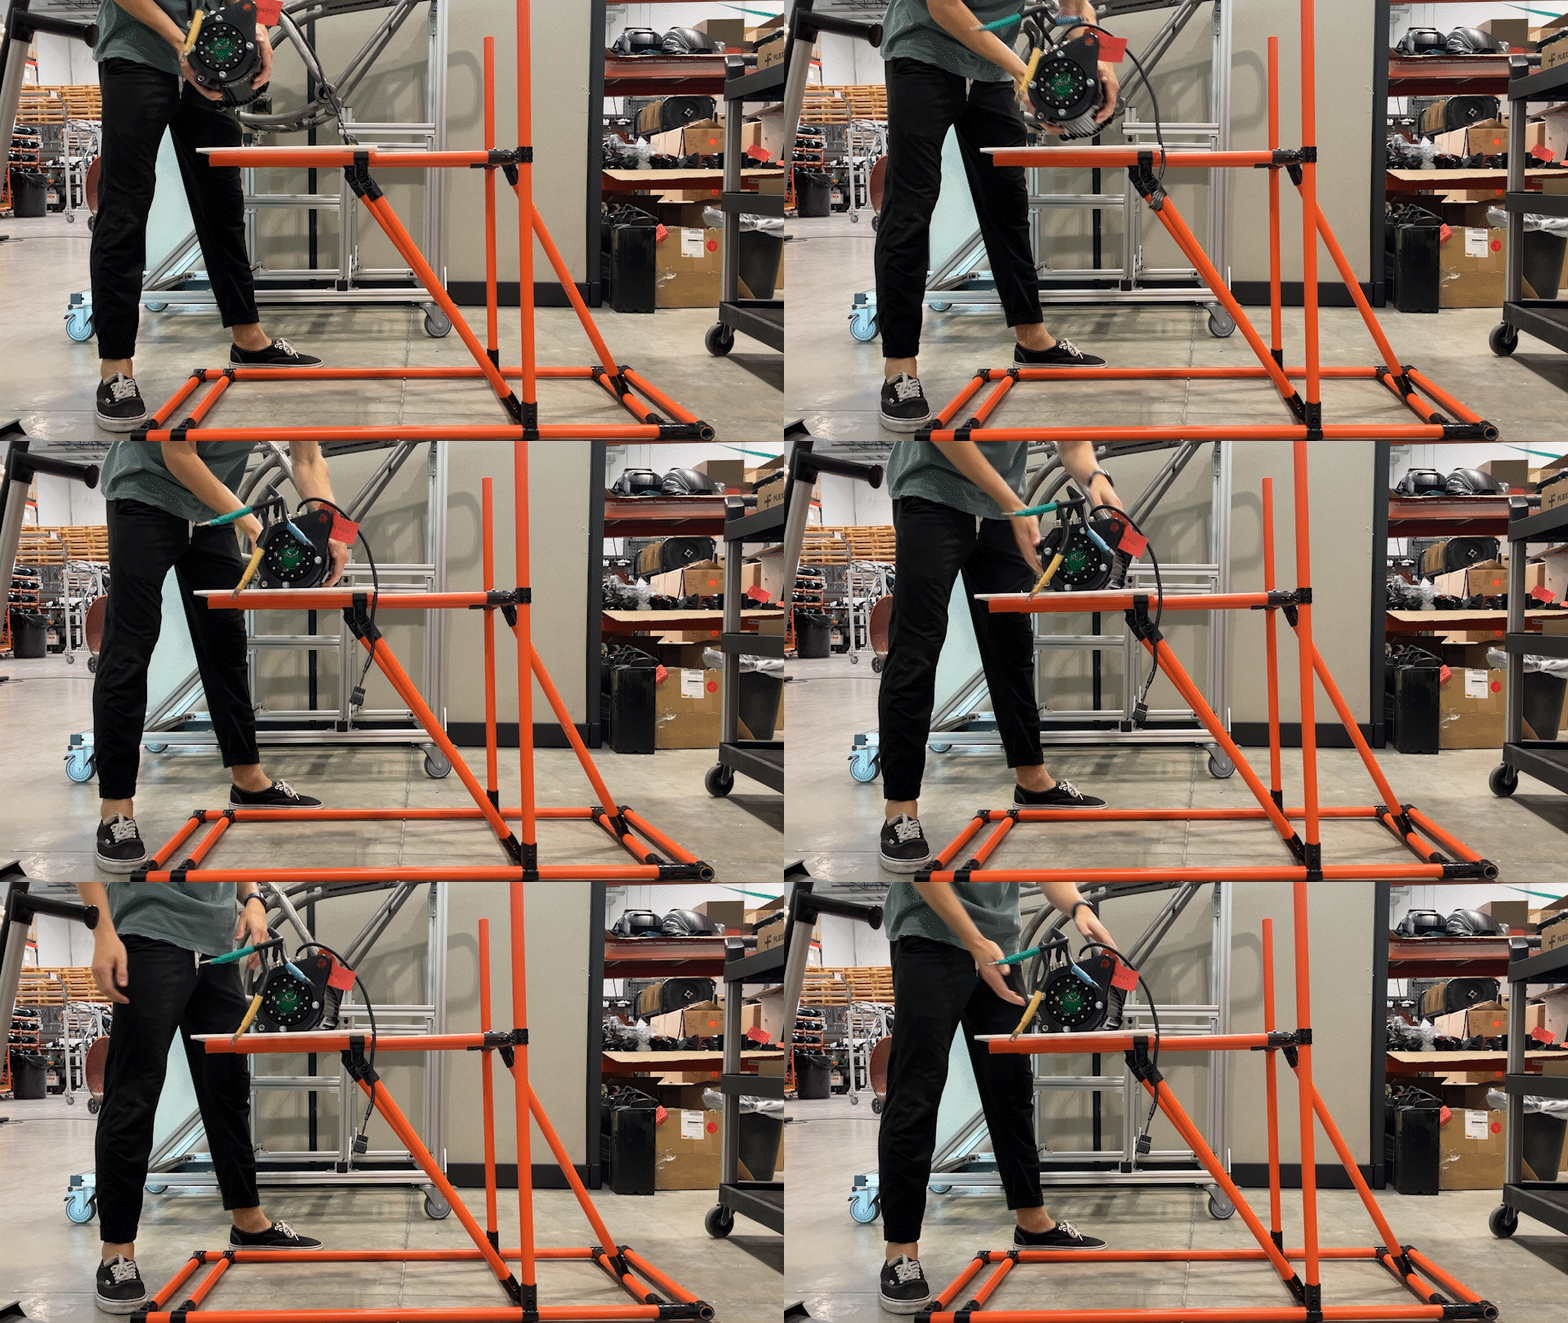
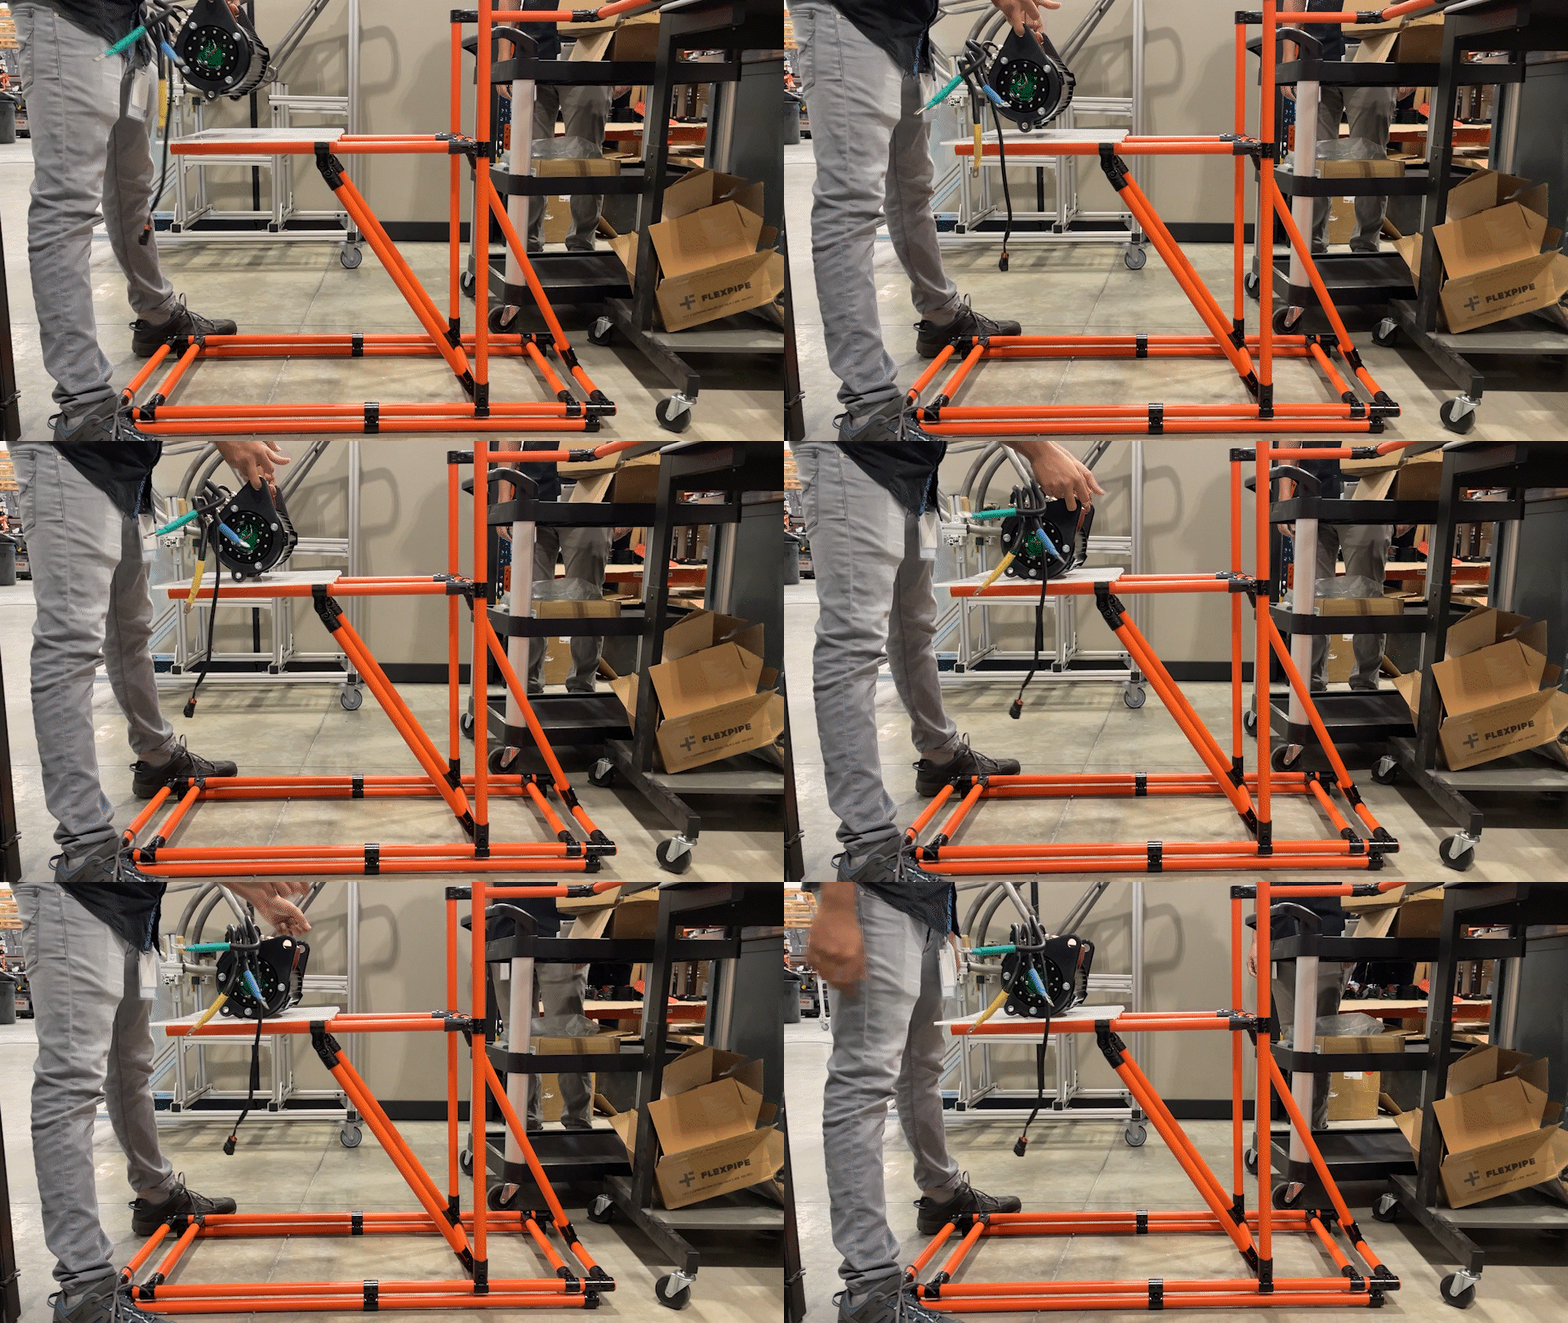
After constructing the frame, I noticed the platform would flex somewhat excessively when loaded with the motor. To fix this, I added a second member below the base to increase its flexural rigidity. From the following media, the change in deflection looks somewhat minor, but this stiffening made a significant effect on user confidence when loading the frame.

Fixture Design

The fixture I designed was a two-piece half-circle cradle that fits the outer diameter of the motor. This design secures the motor as the trolley is positioned, but also allows for the motor to be rotated to its mounting brackets once in position.

The fixture was 3D printed from abs plastic, chosen for its strength and low-friction surface to allow the motor to be rotated. This fixture was then attached to the trolley base using threaded inserts.

Fixture Being Printed

Motor Washer Restraints

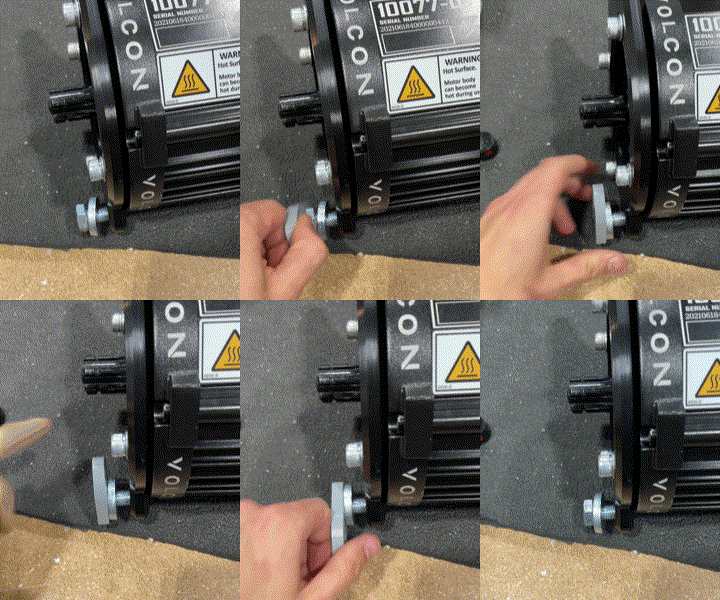
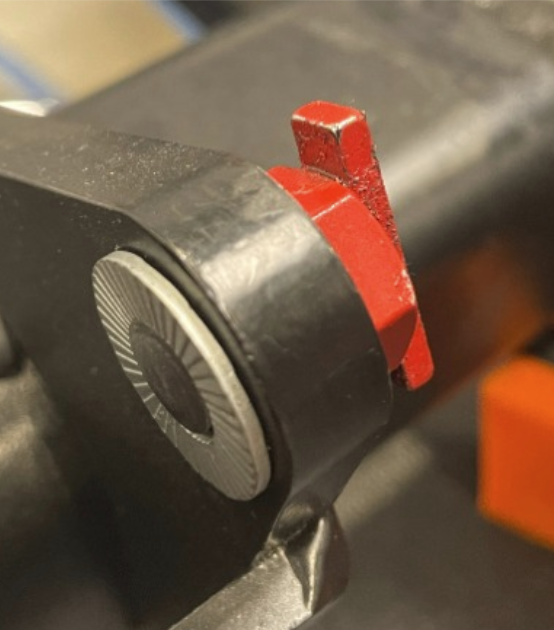
Another design that was implemented with this cart was that of a custom ‘washer restraint’. The idea for this device came about when observing the fact that associates would often have to hold the motor washers back during installation, presenting a possible pinch hazard.

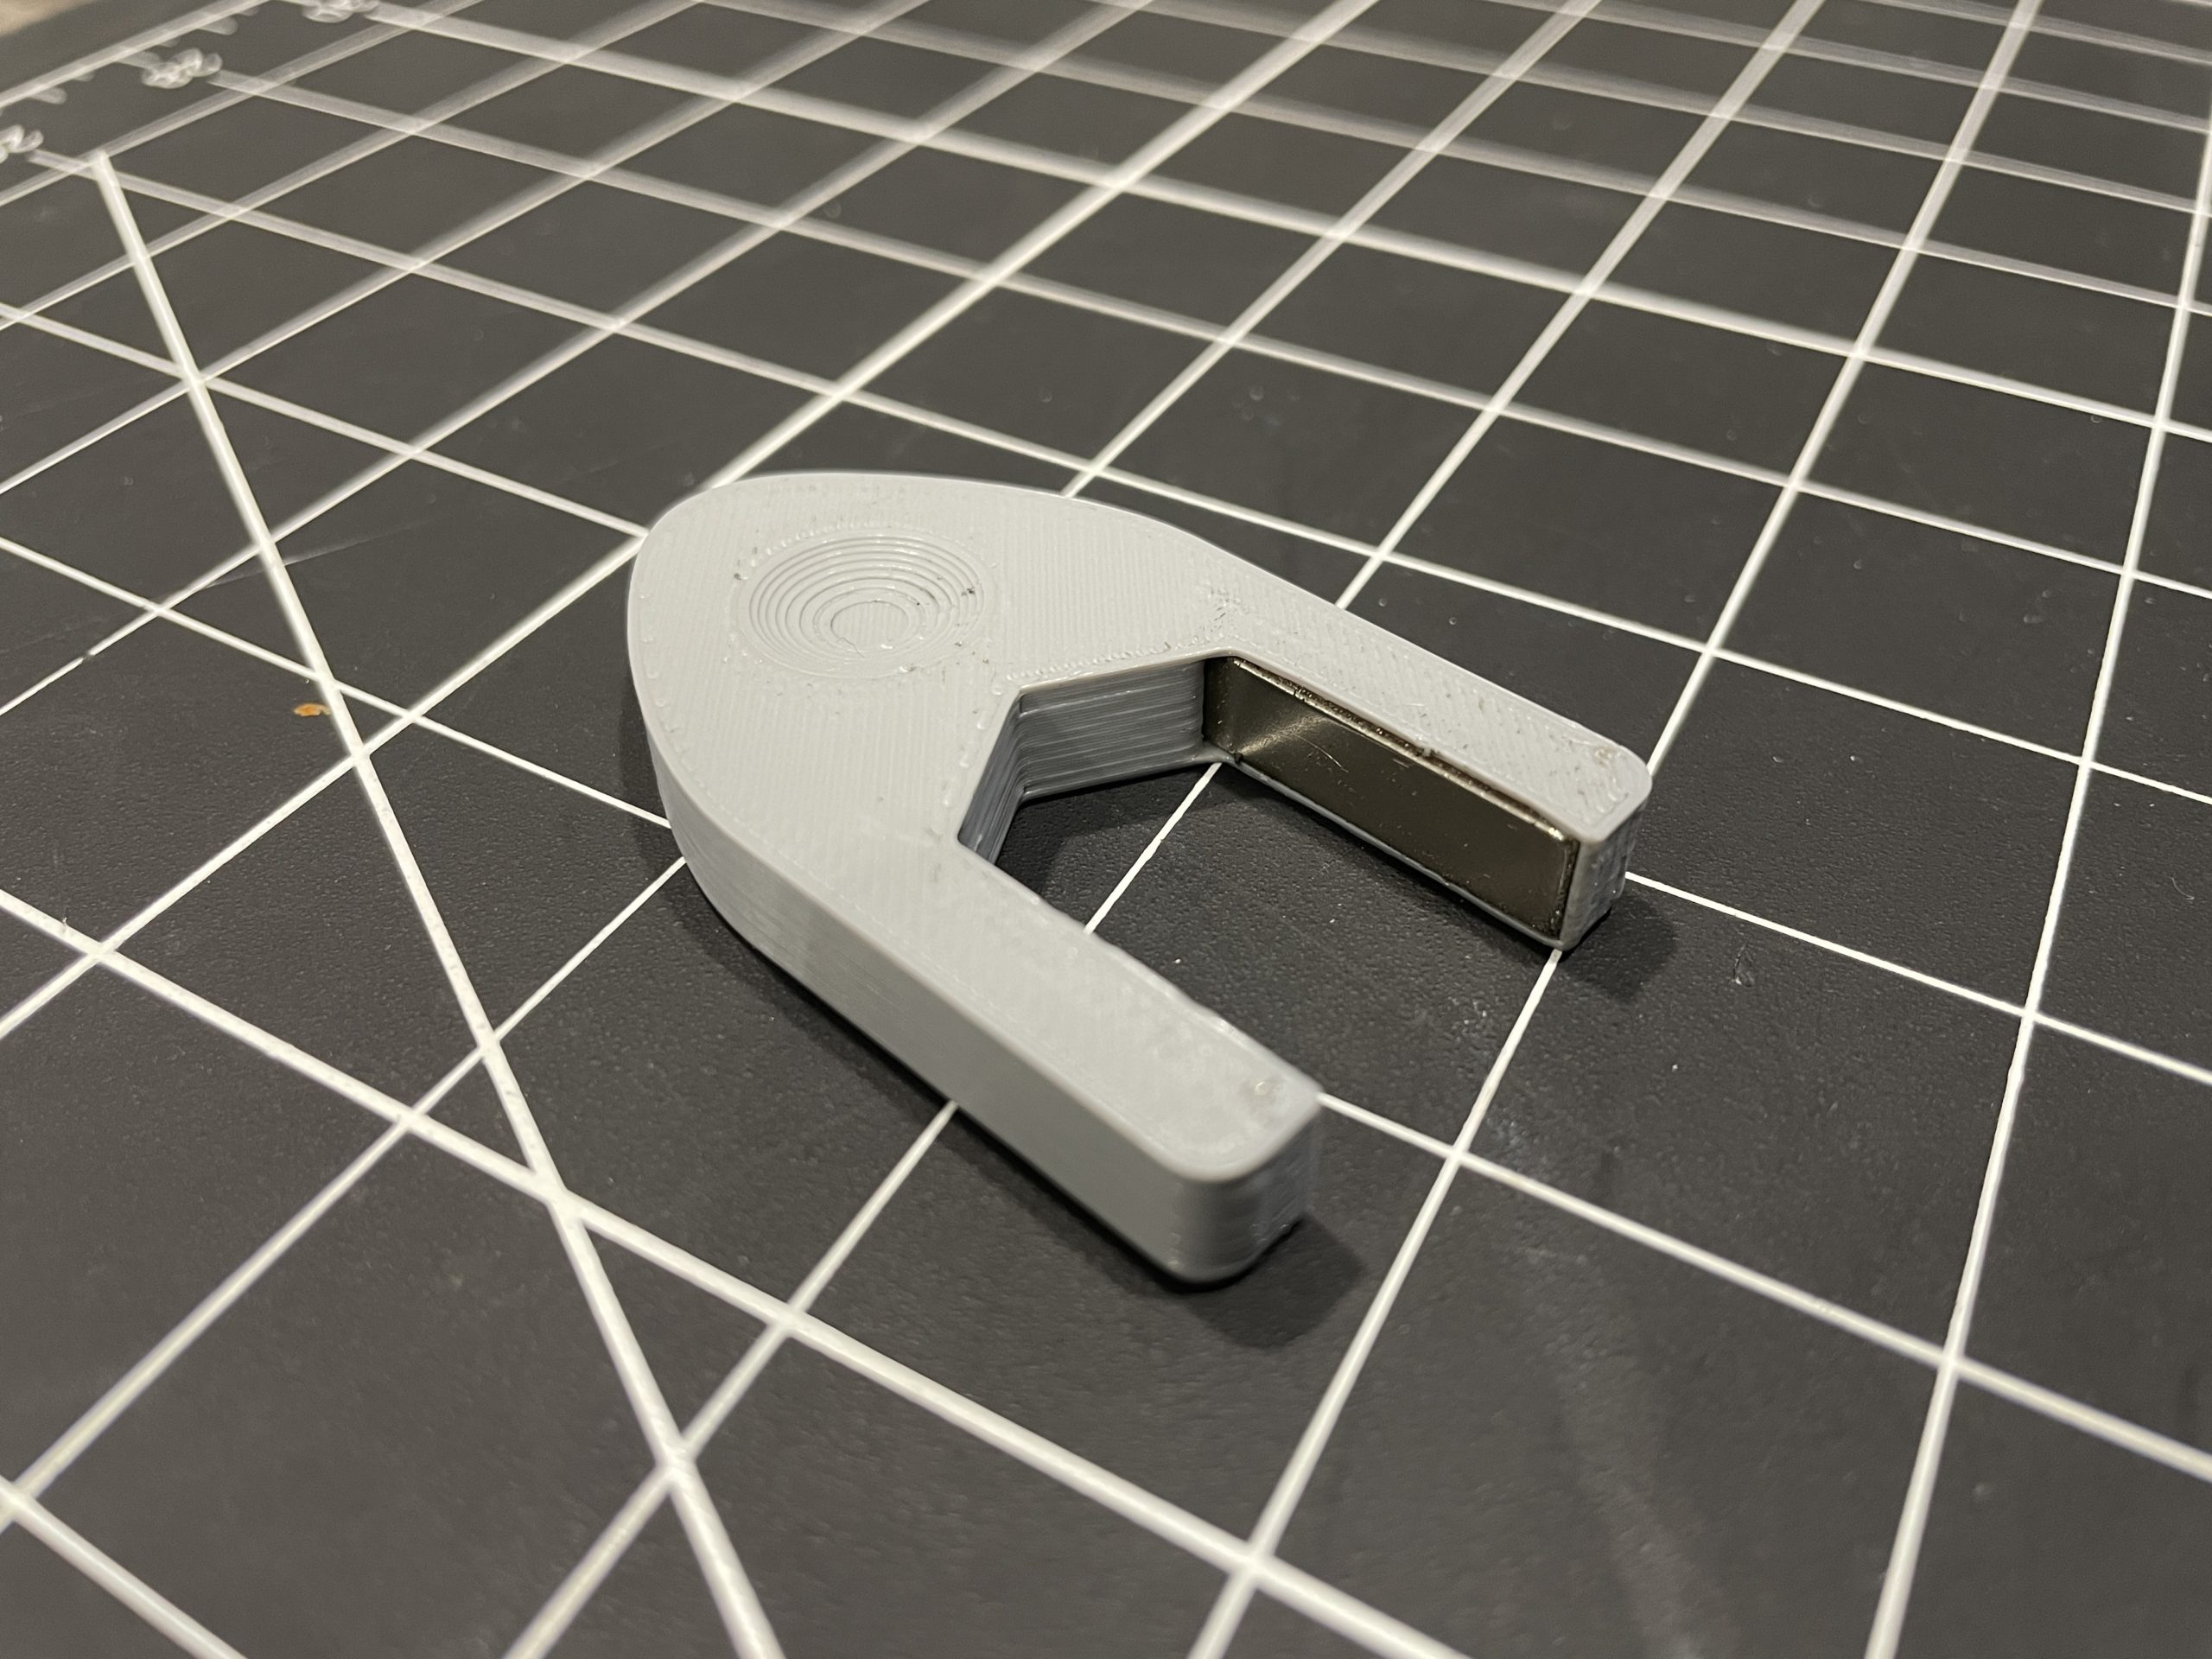
To solve this, I designed a part that would go around the bolt with magnetic inserts, keeping the washers in place and alleviating the pinch hazard.

Once I tested the device and was satisfied with its function, I made more sets and updated the motor assembly process to have them pre-installed at this substation.

Swingarm Installation Fixture

With the motor installation cart finished, I proceeded to create a similar trolley with a modified fixture to hold the swingarm. This was created using a Solidworks cavity feature to fit the complicated geometry of the part

This fixture was printed with grippy and soft TPU and was likewise fastened with threaded inserts.

Swingarm Washer Restraint

I also developed a washer restraint for the swingarm cart. The basic design was a magnetized rod that would secure a washer around its edge. This restraint would be easily pushed out as the associate inserted a bolt into the hole.

Outcome

These carts were able to improve these operations by decreasing the risk of operator injury and NCM incidents, all while improving time efficiency by about 10%.

Learnings

The design process for these devices helped further develop my ability to come up with innovative solutions to unique problems.

Safety Systems

Introduction

Like many racing series, the Formula SAE competition requires safety equipment for drivers to race. I was responsible for a few safety systems on our car, specifically the impact attenuator, firewall, and head restraint.

Impact attenuator

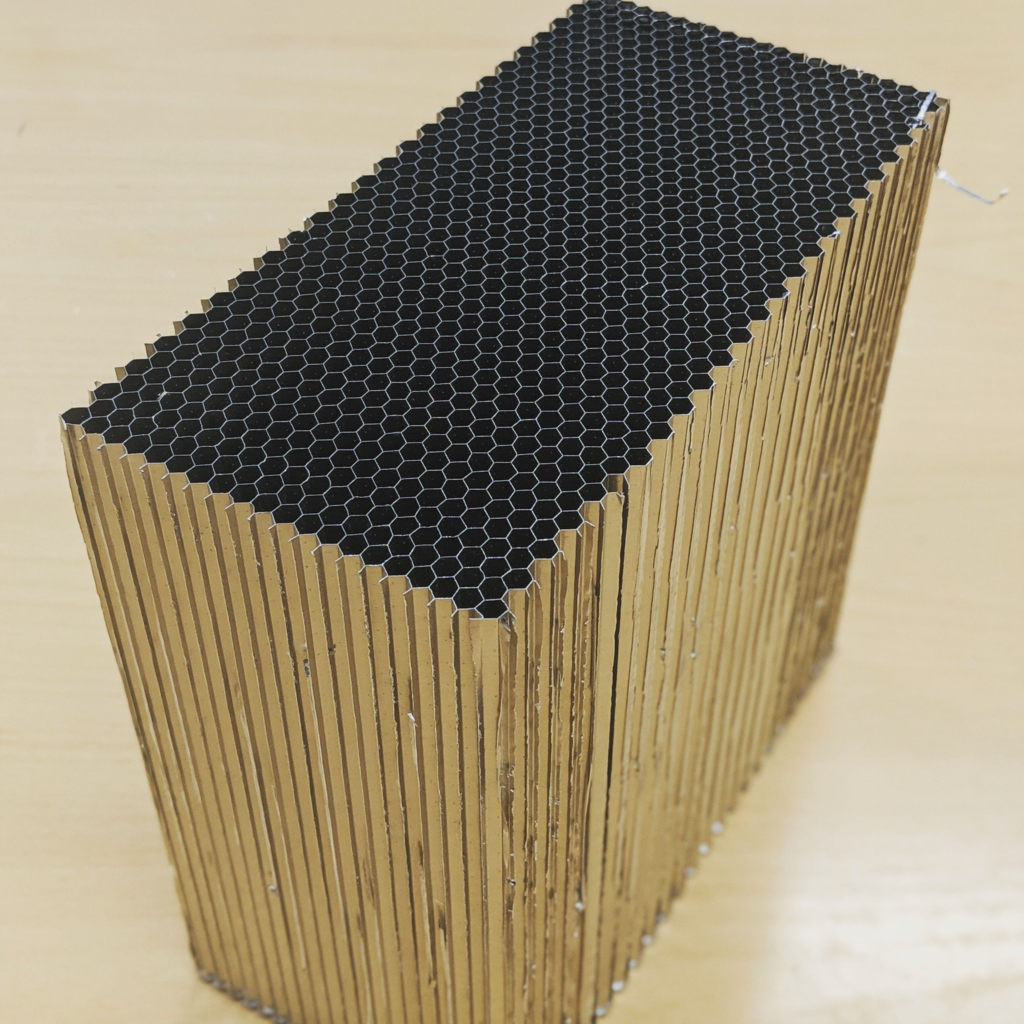
For the impact attenuator, I had the option of making a custom device or using one of the two standard attenuators. Because a custom attenuator demands extra testing time and budget while offering nearly no performance benefit, a standard attenuator was the obvious choice.

Between the two standard attenuators shown above, the honeycomb aluminum design was chosen over foam because of its smaller footprint, allowing the Aero team more space to design their nosecone.

Installed Honeycomb Attenuator

Firewall

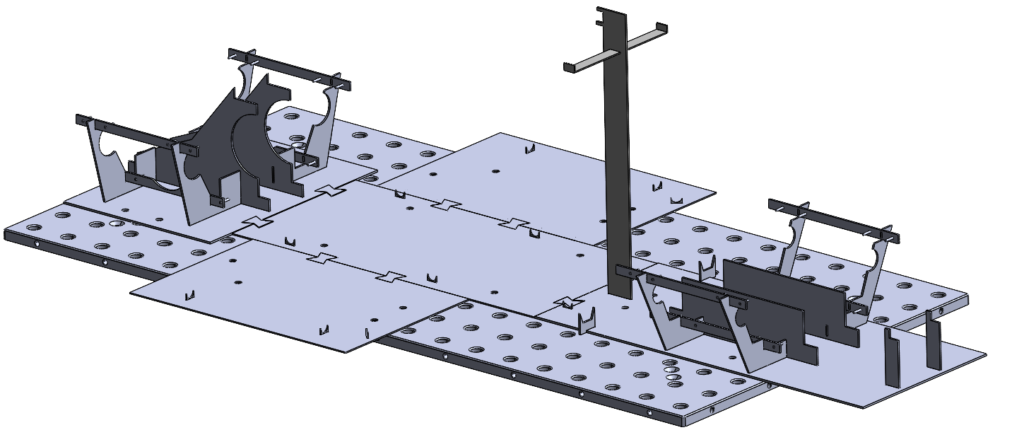
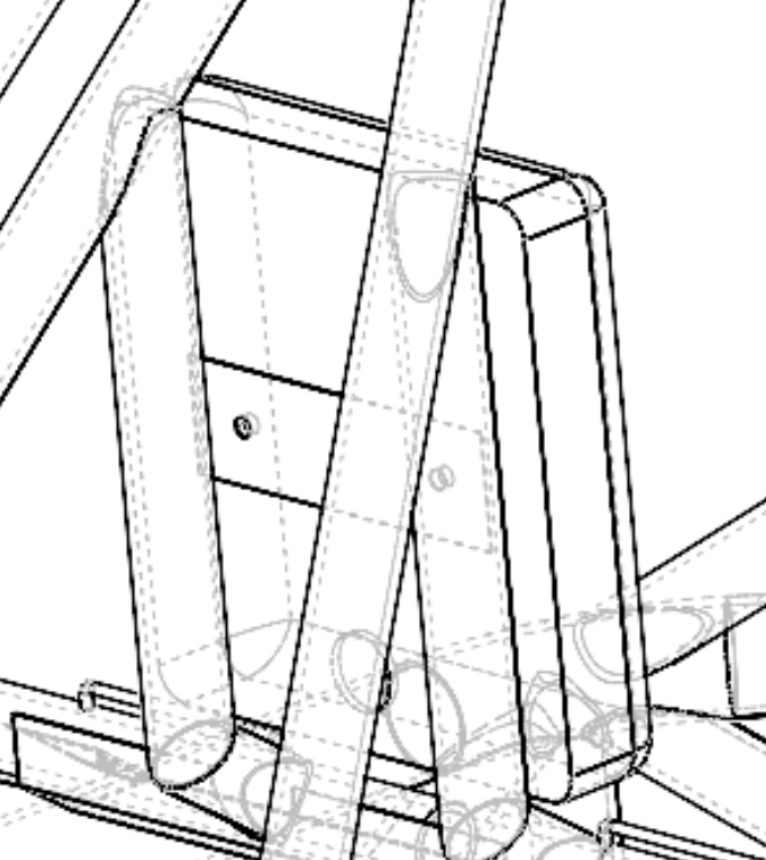
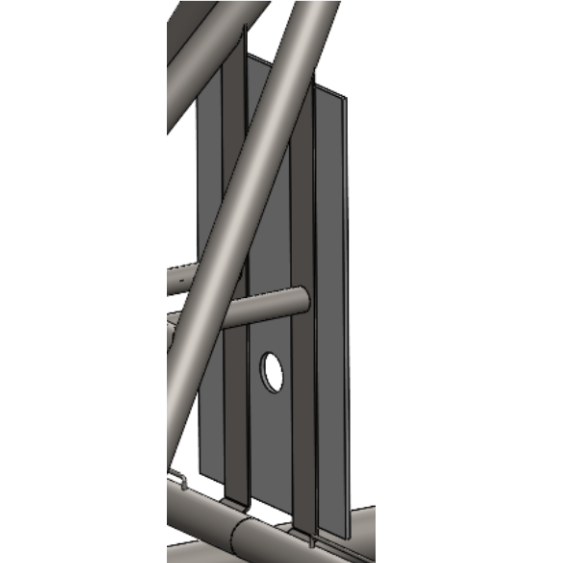
For the design of the structure, I utilized the Solidworks sheet metal tool, adding bends to avoid interference with the chassis. To attach the firewall, riv-nuts were used in the spots where the firewall would need to be removed and installed frequently to ease this process.

CAD of The Firewall

The final product was fabricated from a dual-layer system of aluminum and Nomex 410 paper.

Head Restraint

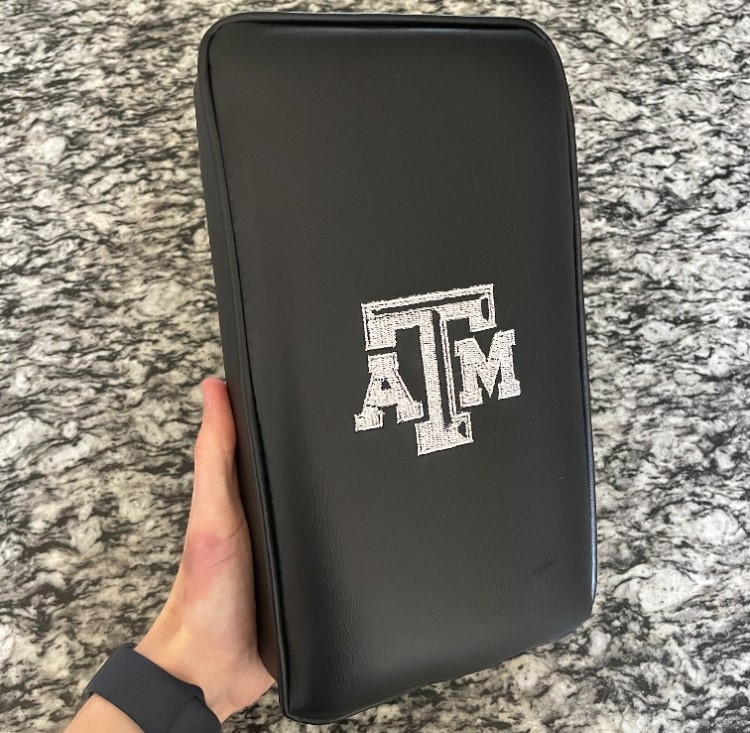
The final safety system I oversaw was the driver head restraint. It is required by rules that the mounting of this device is capable of sustaining 900N of rearward load and 300N of shear load.

For the construction of the headrest itself, I utilized HPDE backing, Confor Impact foam, and a vinyl cover. To assemble the final product, I was able to reach out to a previous team member to do all upholstery work free of charge.

Outcome

Each system obtained approval from the inspectors, making our car the first TAMU FSAE EV to pass the rigorous tech inspection.

Learnings

While the designs were primarily rules-defined, it was an enjoyable experience to explore how to adhere to those rules while creating lightweight and user-friendly products. This is a skill I could use in industry, where many designs have to be effective while following some set of rules or codes.