Introduction
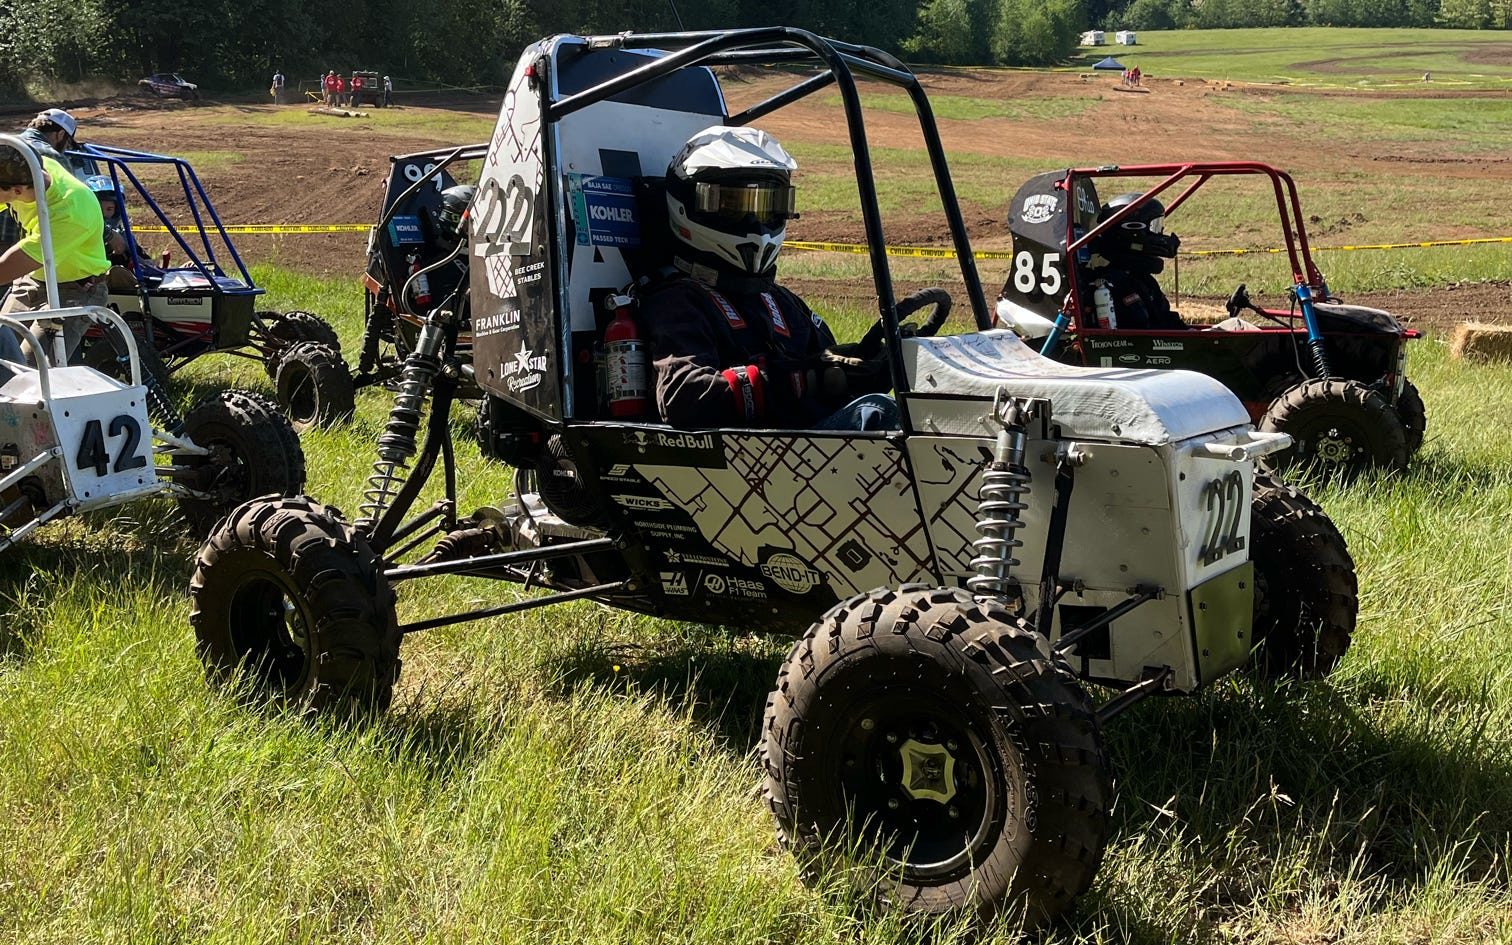
As the sole brakes engineer for TAMU Baja, I designed, manufactured, and tested a reliable, lightweight braking system for use in the 2023 vehicle.
Design Philosophy
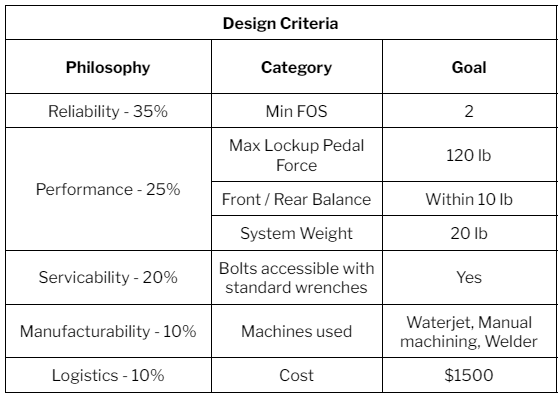
At the beginning of the season, I helped establish a design philosophy to guide all team members as they make engineering compromises throughout the season.

Throughout the season, I referenced this guide to ensure I was creating a system in accordance with the agreed-upon vision for the car.
Braking Force Calculations
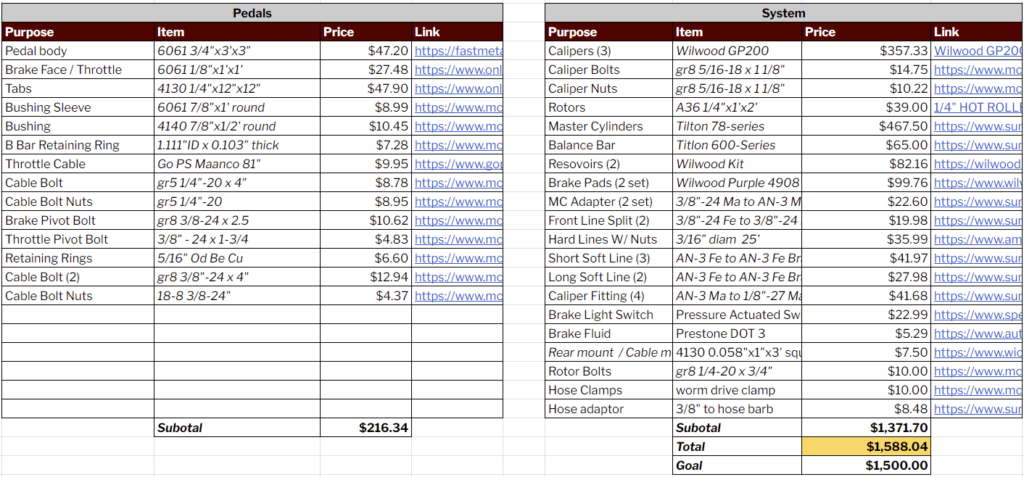
As the balance and strength of the braking system are a product of many design choices, I constructed an Excel Braking Calculator to ensure my design would be able to lock all four tires as I experimented with design changes.
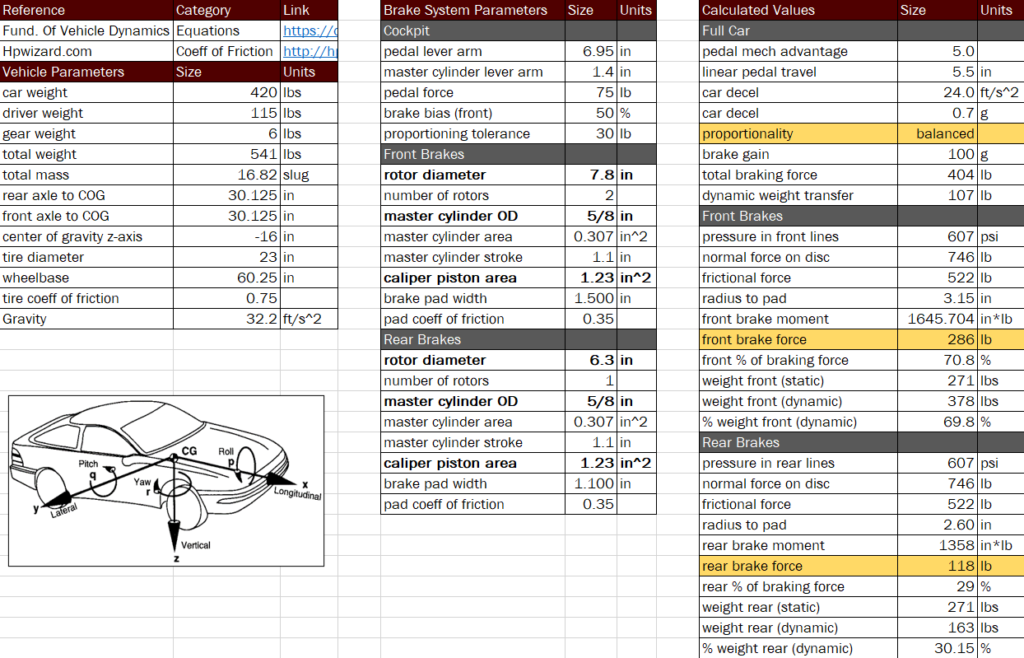
From the data shown above, the calculator would create a brake proportioning plot.
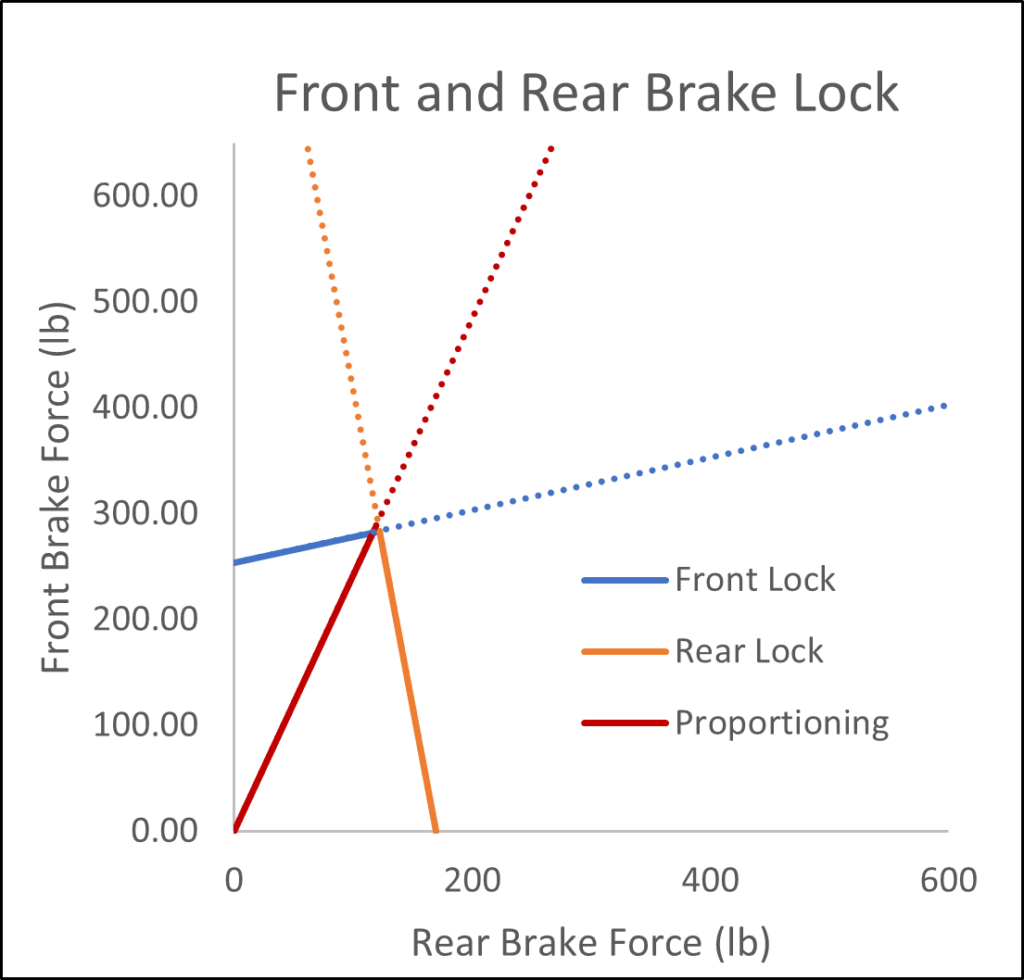
As the brake designer, my objective is to design a system that is balanced such that the ‘Proportioning’ line points straight at the intersection of the ‘Lock’ lines. As well, it must provide enough mechanical advantage so a driver can reach this wheel lock with reasonable pedal force.
To help understand how to read these figures, some examples of proportioning plots for different systems are shown below.

Pedal Configuration
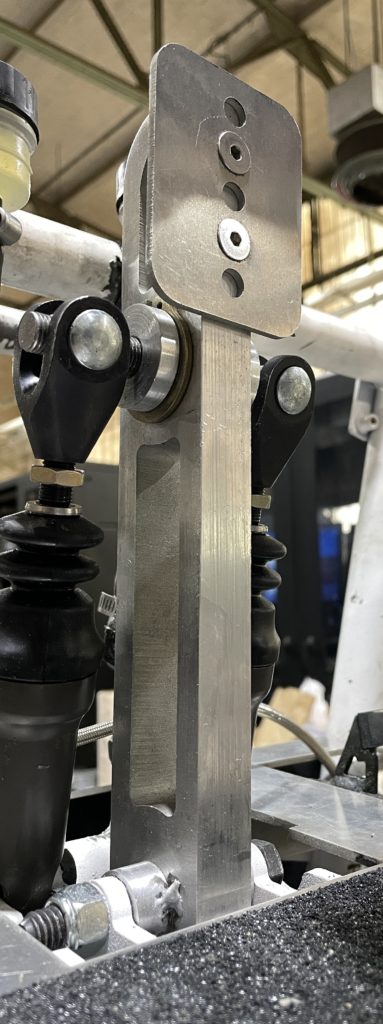
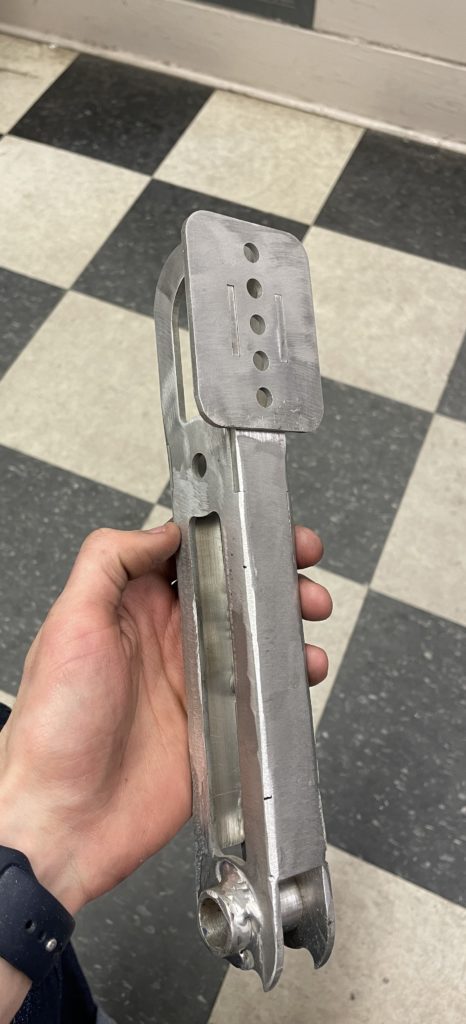
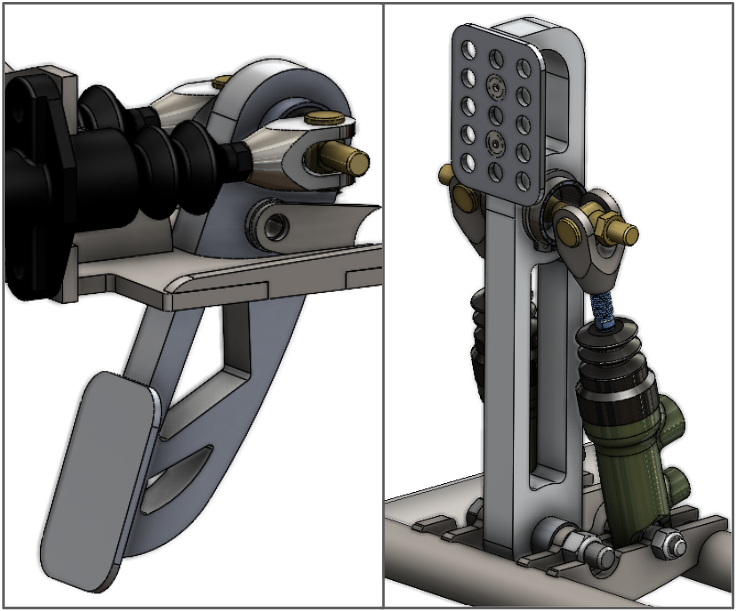
For the brake pedal configuration, I considered two main options: top mounted with linear master cylinders, and bottom mounted with pivoting master cylinders.
To help me choose between these, I constructed a decision matrix based on the overall team design philosophy. In this matrix, categories that could be numerically justified such as Mass, CG, and Logistics (which was based on cost) had normalized scores based on sample designs for each configuration. Other scores were chosen based on empirical research and intuition.

As shown, the matrix resulted in the selection of a bottom-mounted pedal.
Component Selection
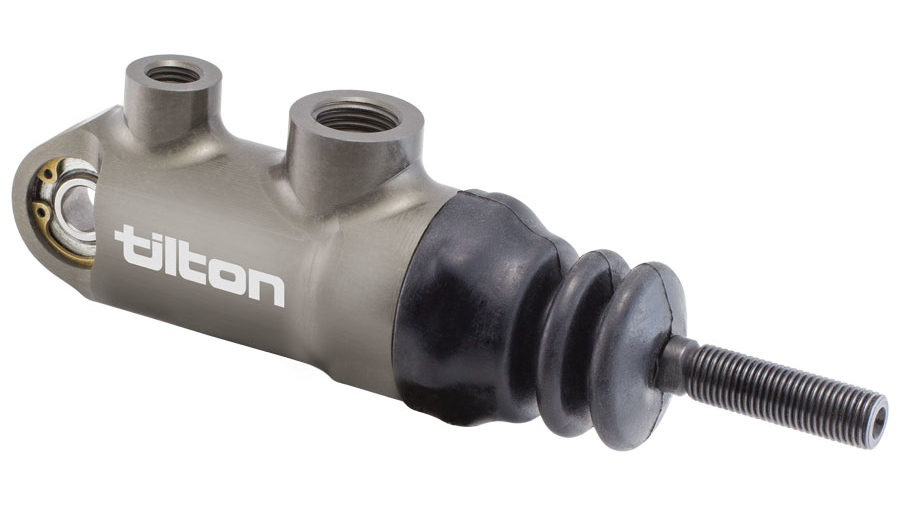
The selection of master cylinder model was quite easy, as options for pivoting master cylinders required by my design are limited. Ultimately, the Tilton 78-Series master cylinders were chosen for their quality and availability of product information.
The calipers chosen were the Wilwood GP200. These were preferred to the PS-1 calipers used by previous teams because they were lighter and offered larger bore diameter options.

For the selection of master cylinder and caliper bore diameters, I chose the smallest master cylinder diameter and largest piston bore diameter to maximize my hydraulic advantage. This allows me to reduce the size of my pedal and rotors for easier packaging while still maintaining sufficient braking strength.
Rotor Thermal Simulations
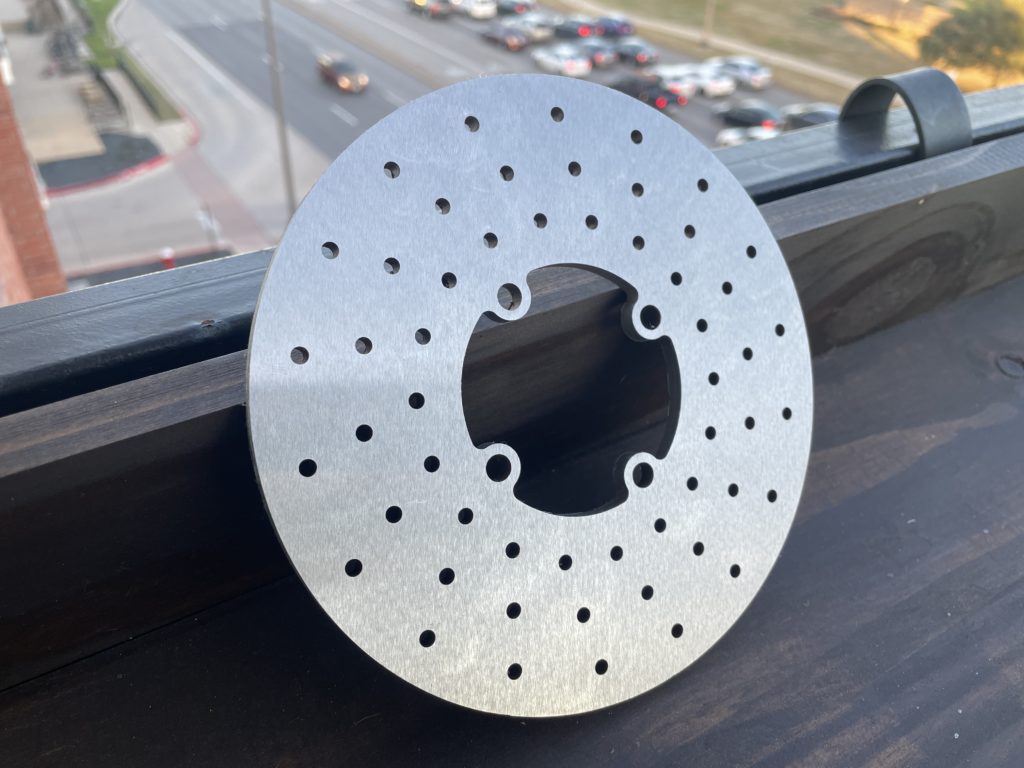
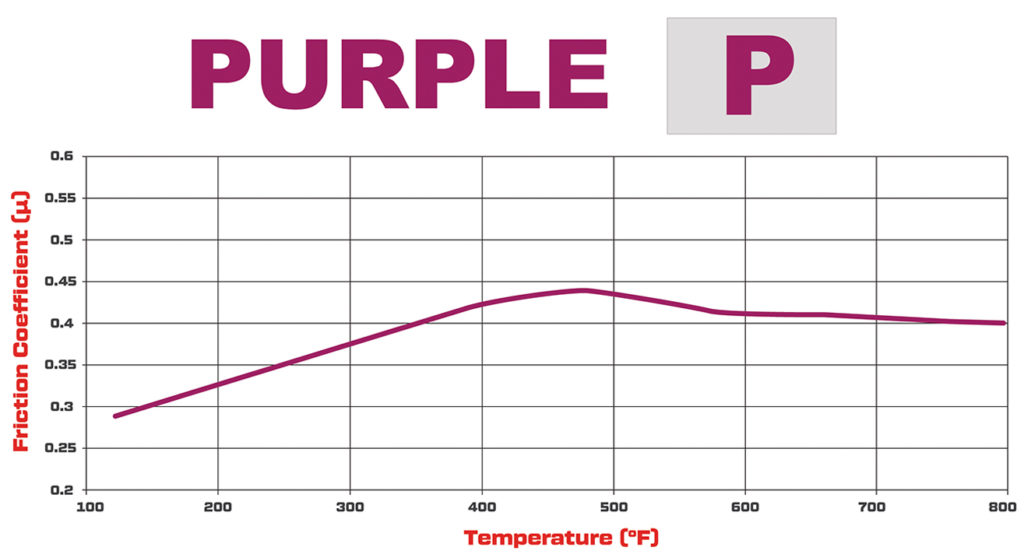
Because the frictional coefficient of the brake pads, and consequently braking force, is dependent on temperature, I performed some thermal simulations to estimate my rotor temperature (roughly equal to the pad temperature).
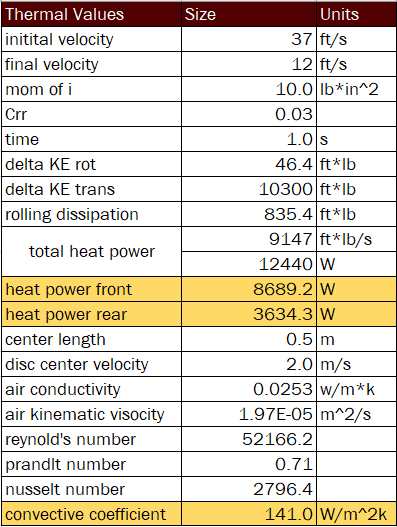
For these simulations, I calculated the heat power needed to slow the car from straight-line speed to cornering speed based on the linear and angular momentum change from this deceleration, then subtracted the work done by rolling resistance. To estimate the convective coefficient, I used a flat-plate correlation equation from “The Fundamentals of Heat and Mass Transfer” along with the average center velocity of the disc. The bulk temperature was chosen to be 60 Fahrenheit based on typical weather in Woshugal MX Park where the vehicle would compete. Finally, I found the time required to perform this deceleration based on my braking force calculations.
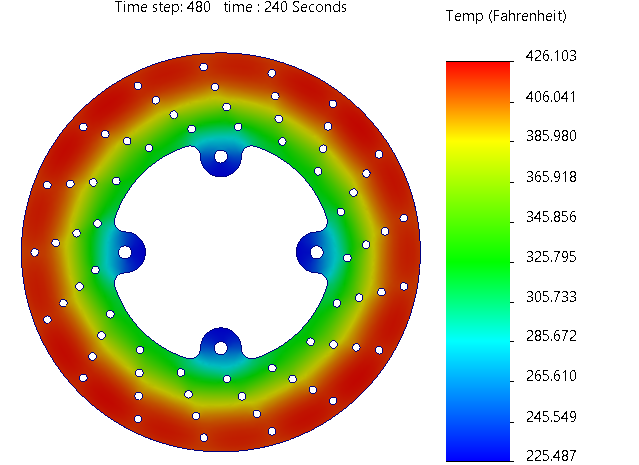
For the numerical simulation, I applied the heat power for the time needed to slow the car and allowed 5-second cooling intervals between. I then selected a node in the friction surface region to generate a Temperature Vs Time Curve. In this plot, the friction surface converges to a temperature of approximately 420 Fahrenheit.
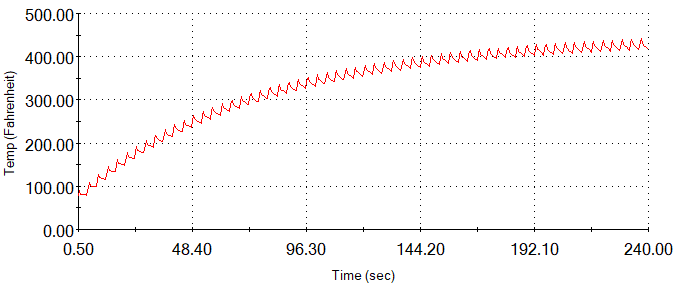
Although many assumptions were made for this simulation, my resulting coefficients and temperatures were all within a reasonable range based on other thermal simulations and tests of Baja SAE brakes.
Comparing the convergence temperature of 420 Fahrenheit with the Friction Coefficient Vs Temperature data for my selected brake pad suggested that I could nearly maximize the friction potential
Manufacturing & Testing
